


Market Analysis: GBP/USD Rockets Higher While EUR/GBP Slips
FXOpen

GBP/USD is gaining pace above the 1.3220 resistance. EUR/GBP declined and is now consolidating losses above the 0.8500 region.
Important Takeaways for GBP/USD and EUR/GBP Analysis Today
· The British Pound is attempting a fresh increase above 1.3220.
· There is a key bullish trend line forming with support near 1.3245 on the hourly chart of GBP/USD at FXOpen.
· EUR/GBP is trading in a bearish zone below the 0.8630 pivot level.
· There is a connecting bearish trend line forming with resistance near 0.8570 on the hourly chart at FXOpen.
GBP/USD Technical Analysis
On the hourly chart of GBP/USD at FXOpen, the pair remained well-bid above the 1.2850 level. The British Pound started a decent increase above the 1.3000 zone against the US Dollar.
The bulls were able to push the pair above the 50-hour simple moving average and 1.3150. The pair even climbed above 1.3200 and traded as high as 1.3263. It is now consolidating gains and trading well above the 23.6% Fib retracement level of the upward move from the 1.3030 swing low to the 1.3263 high.
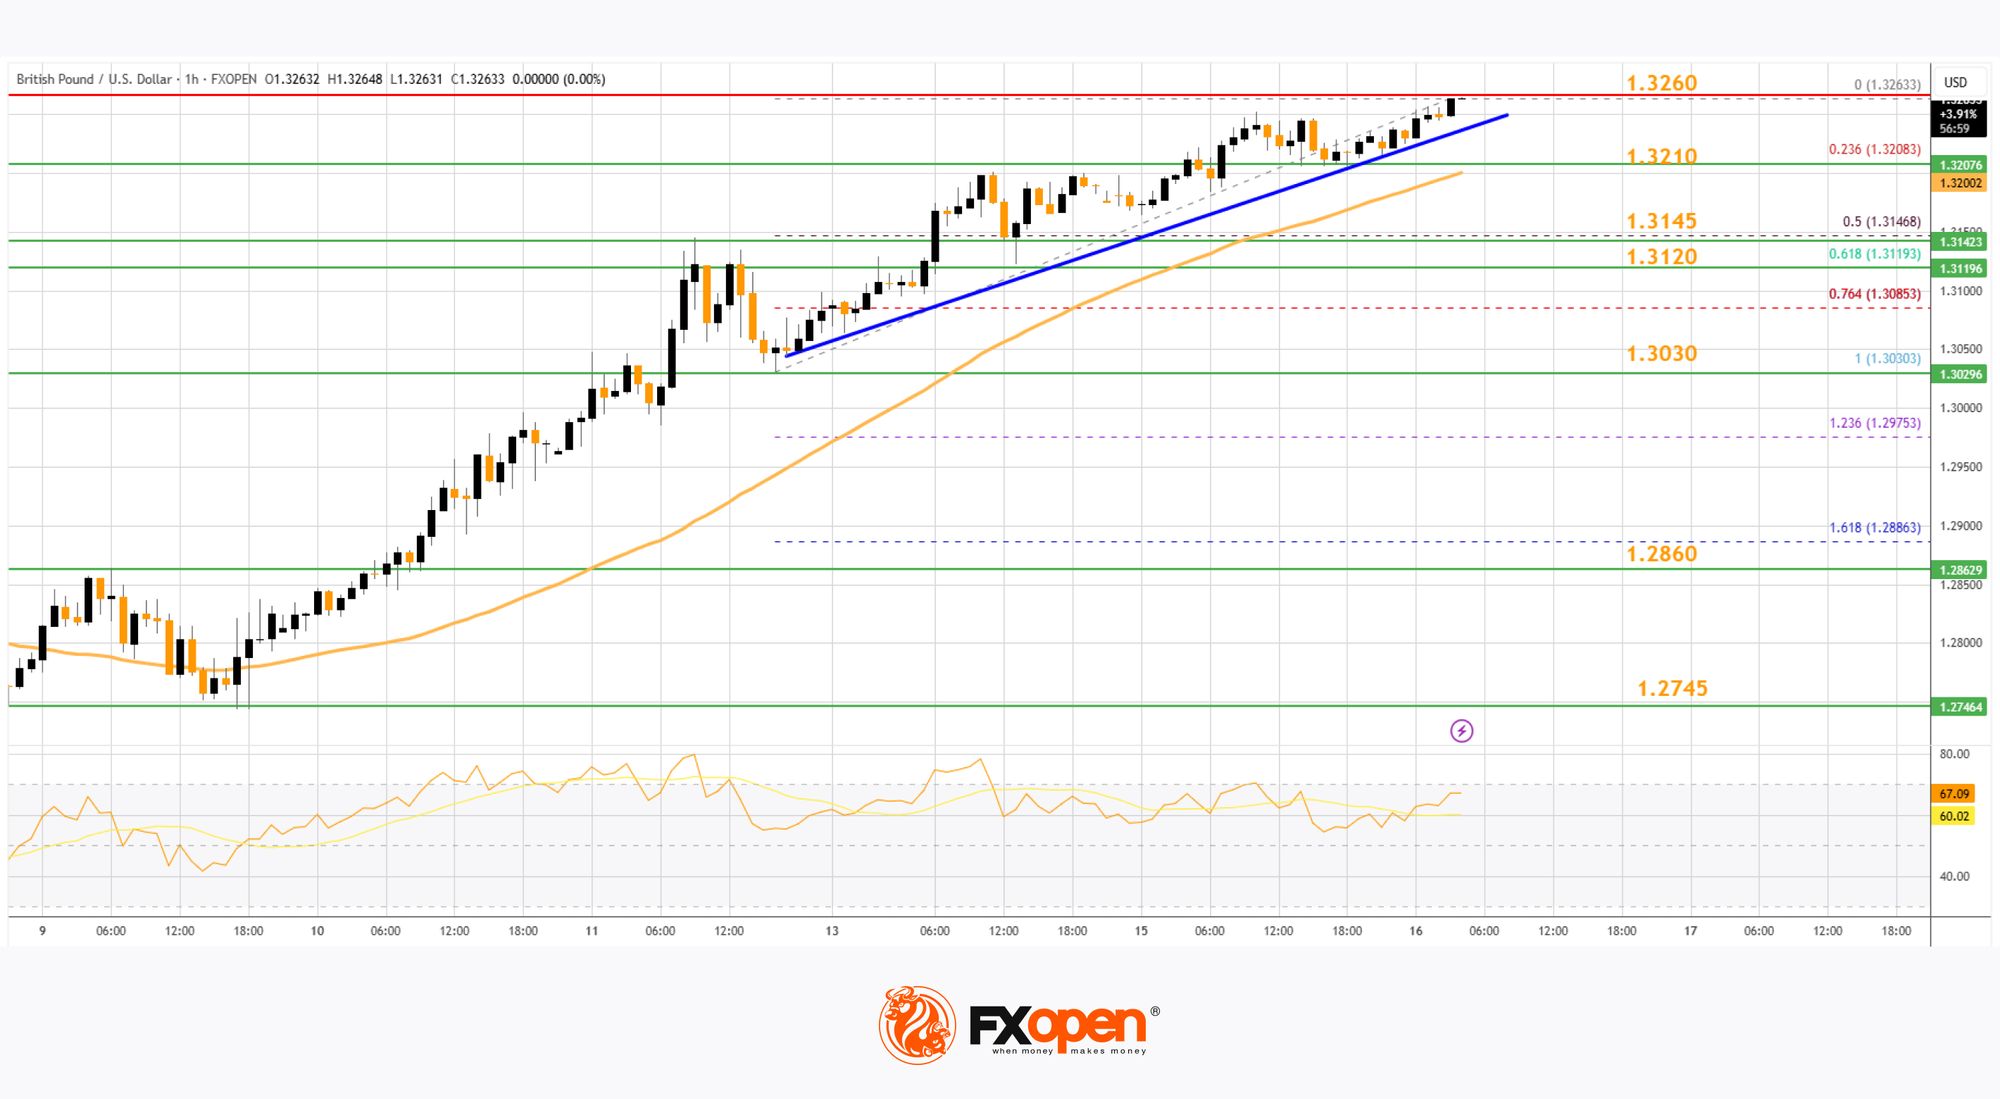
On the upside, the GBP/USD chart indicates that the pair is facing resistance near 1.3260. The next major resistance is near 1.3320. A close above the 1.3320 resistance zone could open the doors for a move toward 1.3450.
Any more gains might send GBP/USD toward 1.3500. On the downside, there is a key support forming near a bullish trend line at 1.3245.
If there is a downside break below 1.3245, the pair could accelerate lower. The next major support is at 1.3145. It is close to the 50% Fib retracement level of the upward move from the 1.3030 swing low to the 1.3263 high.
The next key support is seen near 1.3030, below which the pair could test 1.2860. Any more losses could lead the pair toward the 1.2745 support.
EUR/GBP Technical Analysis
On the hourly chart of EUR/GBP at FXOpen, the pair started a steady decline from well above 0.8700. The Euro traded below the 0.8630 support level against the British Pound.
The EUR/GBP chart suggests that the pair even declined below the 0.8600 level and tested 0.8520. It is now consolidating losses and trading below the 50-hour simple moving average. Recently, there was a minor increase above the 0.8540 level.
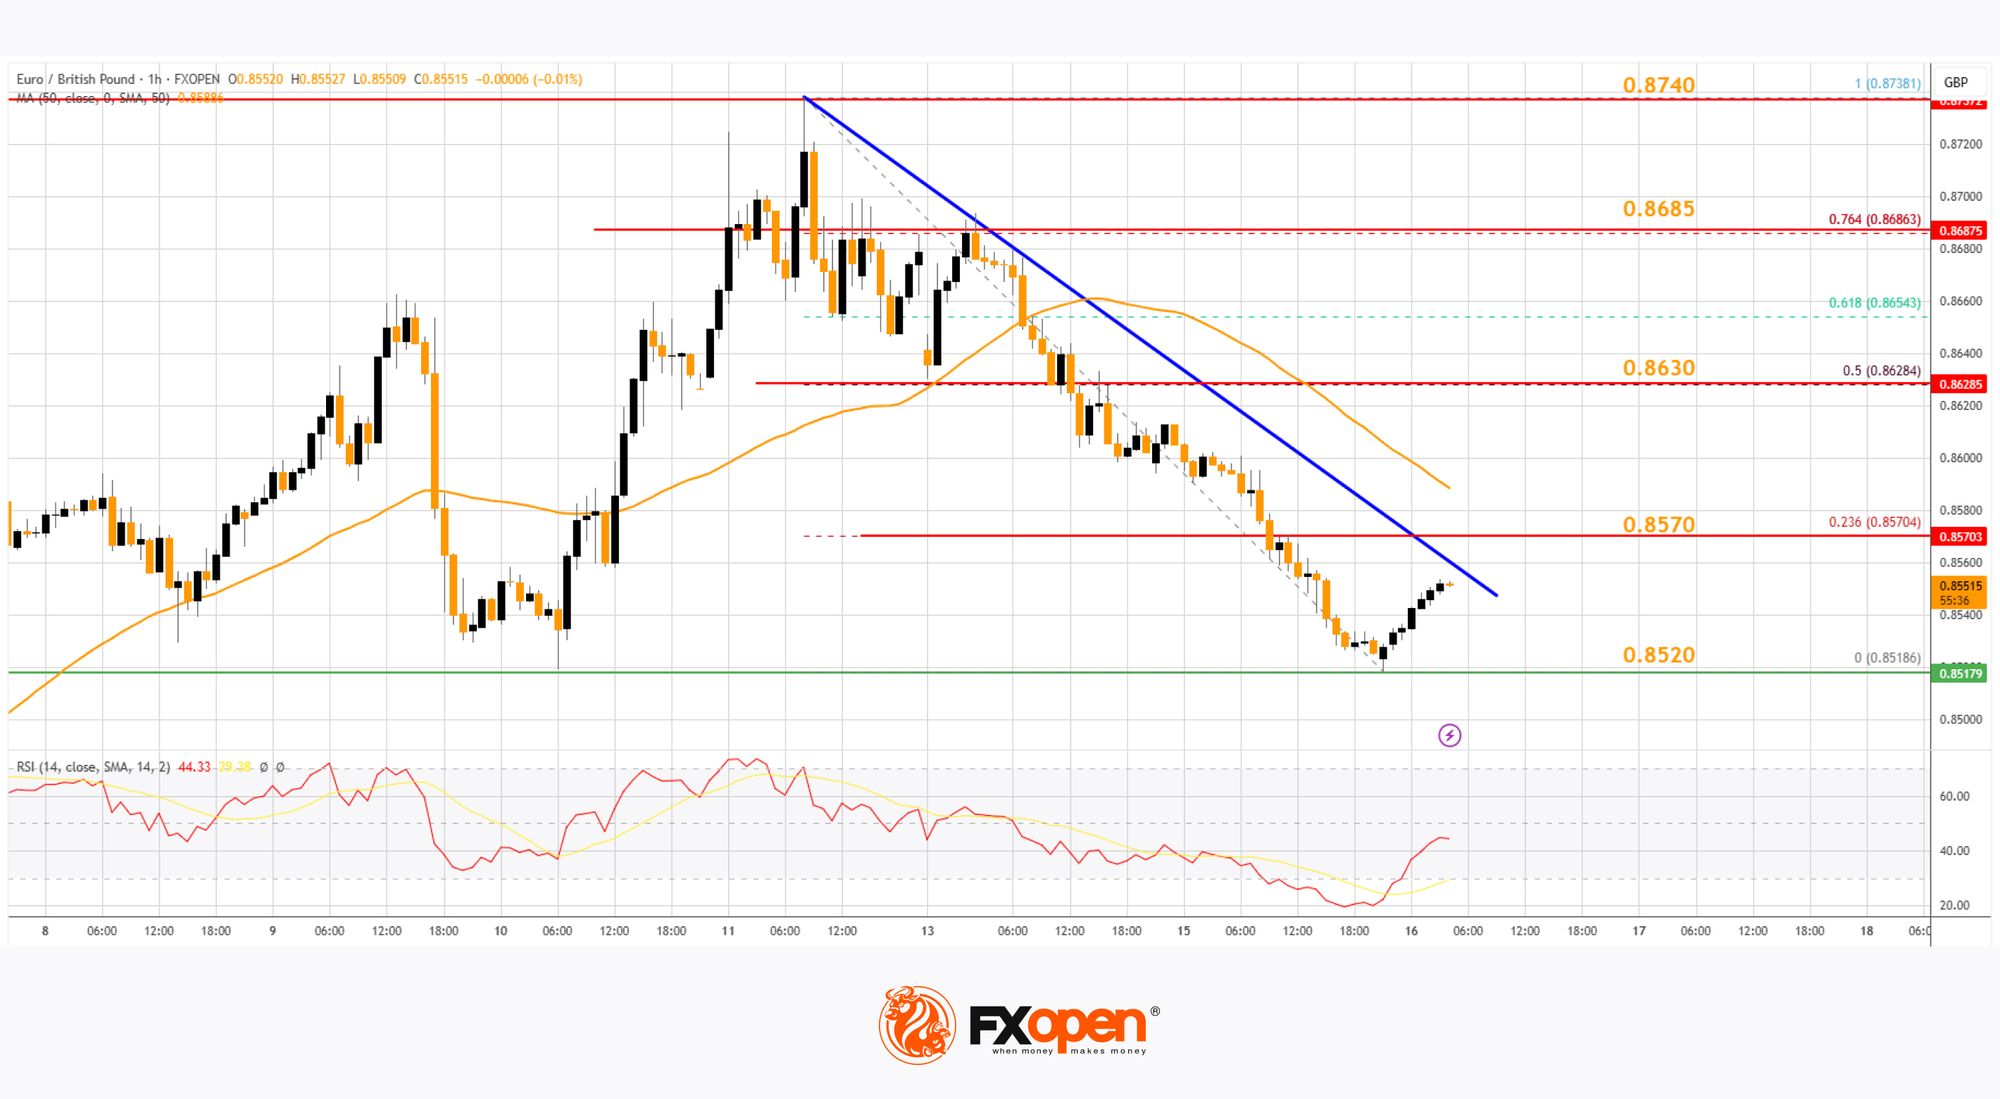
The pair is now facing resistance near the 23.6% Fib retracement level of the downward move from the 0.8738 swing high to the 0.8518 low. There is also a connecting bearish trend line forming with resistance near 0.8570.
The next major resistance could be 0.8630 and the 50% Fib retracement level of the downward move from the 0.8738 swing high to the 0.8518 low.
A close above the 0.8630 level might accelerate gains. In the stated case, the bulls may perhaps aim for a test of 0.8685. Any more gains might send the pair toward the 0.8740 level.
Immediate support sits near 0.8520. The next major support is near 0.8500. A downside break below the 0.8500 support might call for more downsides. In the stated case, the pair could drop toward the 0.8360 support level.
Trade over 50 forex markets 24 hours a day with FXOpen. Take advantage of low commissions, deep liquidity, and spreads from 0.0 pips (additional fees may apply). Open your FXOpen account now or learn more about trading forex with FXOpen.
This article represents the opinion of the Companies operating under the FXOpen brand only. It is not to be construed as an offer, solicitation, or recommendation with respect to products and services provided by the Companies operating under the FXOpen brand, nor is it to be considered financial advice.
Stay ahead of the market!
Subscribe now to our mailing list and receive the latest market news and insights delivered directly to your inbox.


Latest articles

GBP/CHF: Trendline or RSI — Which One Is Lying?
Sterling enters this week on firmer footing, with political uncertainty fading fast after Andy Burnham's confirmation as Labour leader eased investor concerns over the succession to Keir Starmer. Markets reacted further to reports pointing to Shabana Mahmood as the frontrunner

Silver Attempts to Break Out of Its Range
Silver continues to balance between its dual role as an industrial metal and so-called refuge asset, and this combination largely explains the lack of a clear trend in recent weeks. Shifting expectations for central bank interest rates can influence the

Nasdaq 100: Is This the Correction Traders Have Been Waiting For?
The Nasdaq 100 (US Tech 100 Mini on FXOpen) remains caught between two opposing forces: cooling inflation on one side, and persistent geopolitical instability on the other. On 14 July, June's CPI print came in softer than expected, easing near-term