


Market Analysis: GBP/USD Struggles While EUR/GBP Eyes Increase
FXOpen
GBP/USD is struggling below the 1.2235 resistance zone. EUR/GBP is rising and might climb above the 0.8675 resistance.
Important Takeaways for GBP/USD and EUR/GBP Analysis Today
· The British Pound is showing bearish signs below 1.2235 and 1.2270.
· There is a key bullish trend line forming with support near 1.2160 on the hourly chart of GBP/USD at FXOpen.
· EUR/GBP is rising and trading above the 0.8660 zone.
· There is a major bearish trend line forming with resistance near 0.8675 on the hourly chart at FXOpen.
GBP/USD Technical Analysis
On the hourly chart of GBP/USD at FXOpen, the pair attempted a fresh increase above 1.2235. However, the British Pound failed above 1.2270 and started a fresh decline against the US Dollar.
There was a clear move below the 1.2235 support and the 50-hour simple moving average. The pair even traded below the 50% Fib retracement level of the upward move from the 1.2110 swing low to the 1.2271 high.
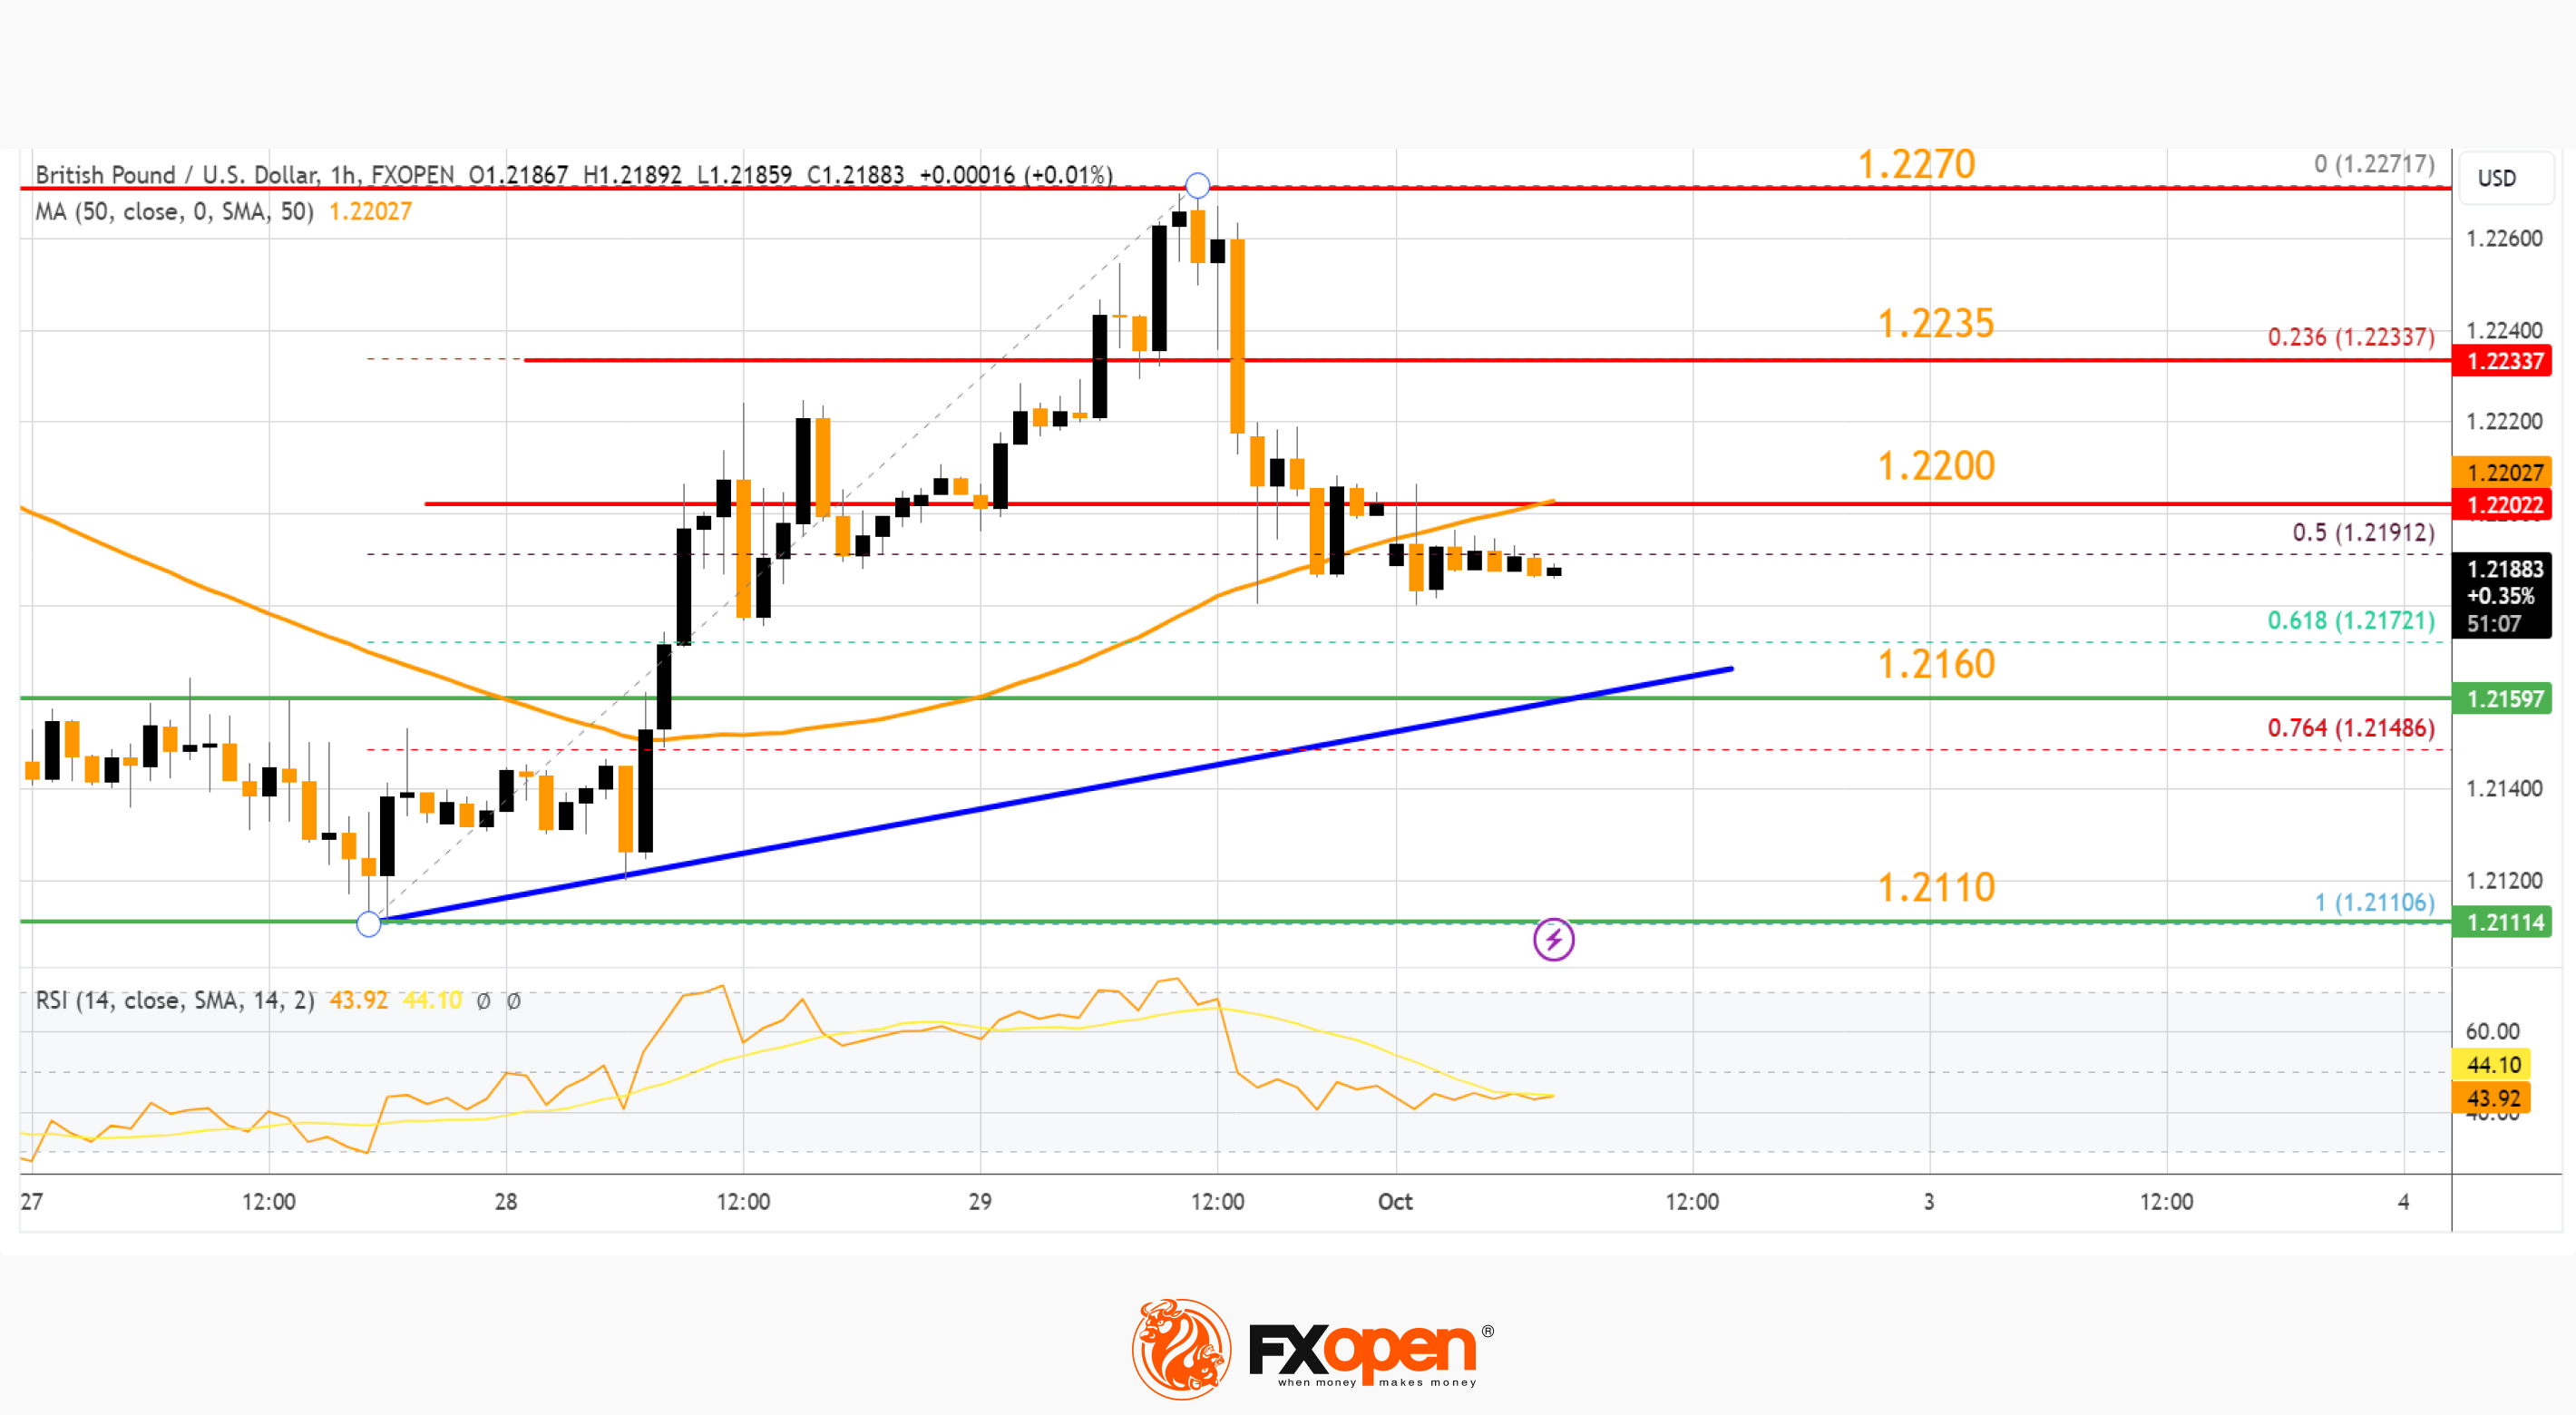
The pair is now showing bearish signs below 1.2200. On the downside, there is a key support forming near 1.2160 or the 76.4% Fib retracement level of the upward move from the 1.2110 swing low to the 1.2271 high.
There is also a key bullish trend line forming with support near 1.2160. If there is a downside break below the 1.2160 support, the pair could accelerate lower.
The next major support is near the 1.2110 zone, below which the pair could test 1.2050. Any more losses could lead the pair toward the 1.2000 support. On the upside, the GBP/USD chart indicates that the pair is facing resistance near the 50-hour simple moving average at 1.2200.
The next major resistance is near 1.2235. A close above the 1.2235 resistance zone could open the doors for a move toward 1.2270. Any more gains might send GBP/USD toward 1.2350.
EUR/GBP Technical Analysis
On the hourly chart of EUR/GBP at FXOpen, the pair started a steady increase from the 0.8630 zone. The Euro traded above the 0.8660 pivot level to enter a positive zone against the British Pound.
The EUR/GBP chart suggests that the pair settled above the 50-hour simple moving average and the 50% Fib retracement level of the last main decline from the 0.8705 swing high to the 0.8629 low. It is now eyeing more upsides.
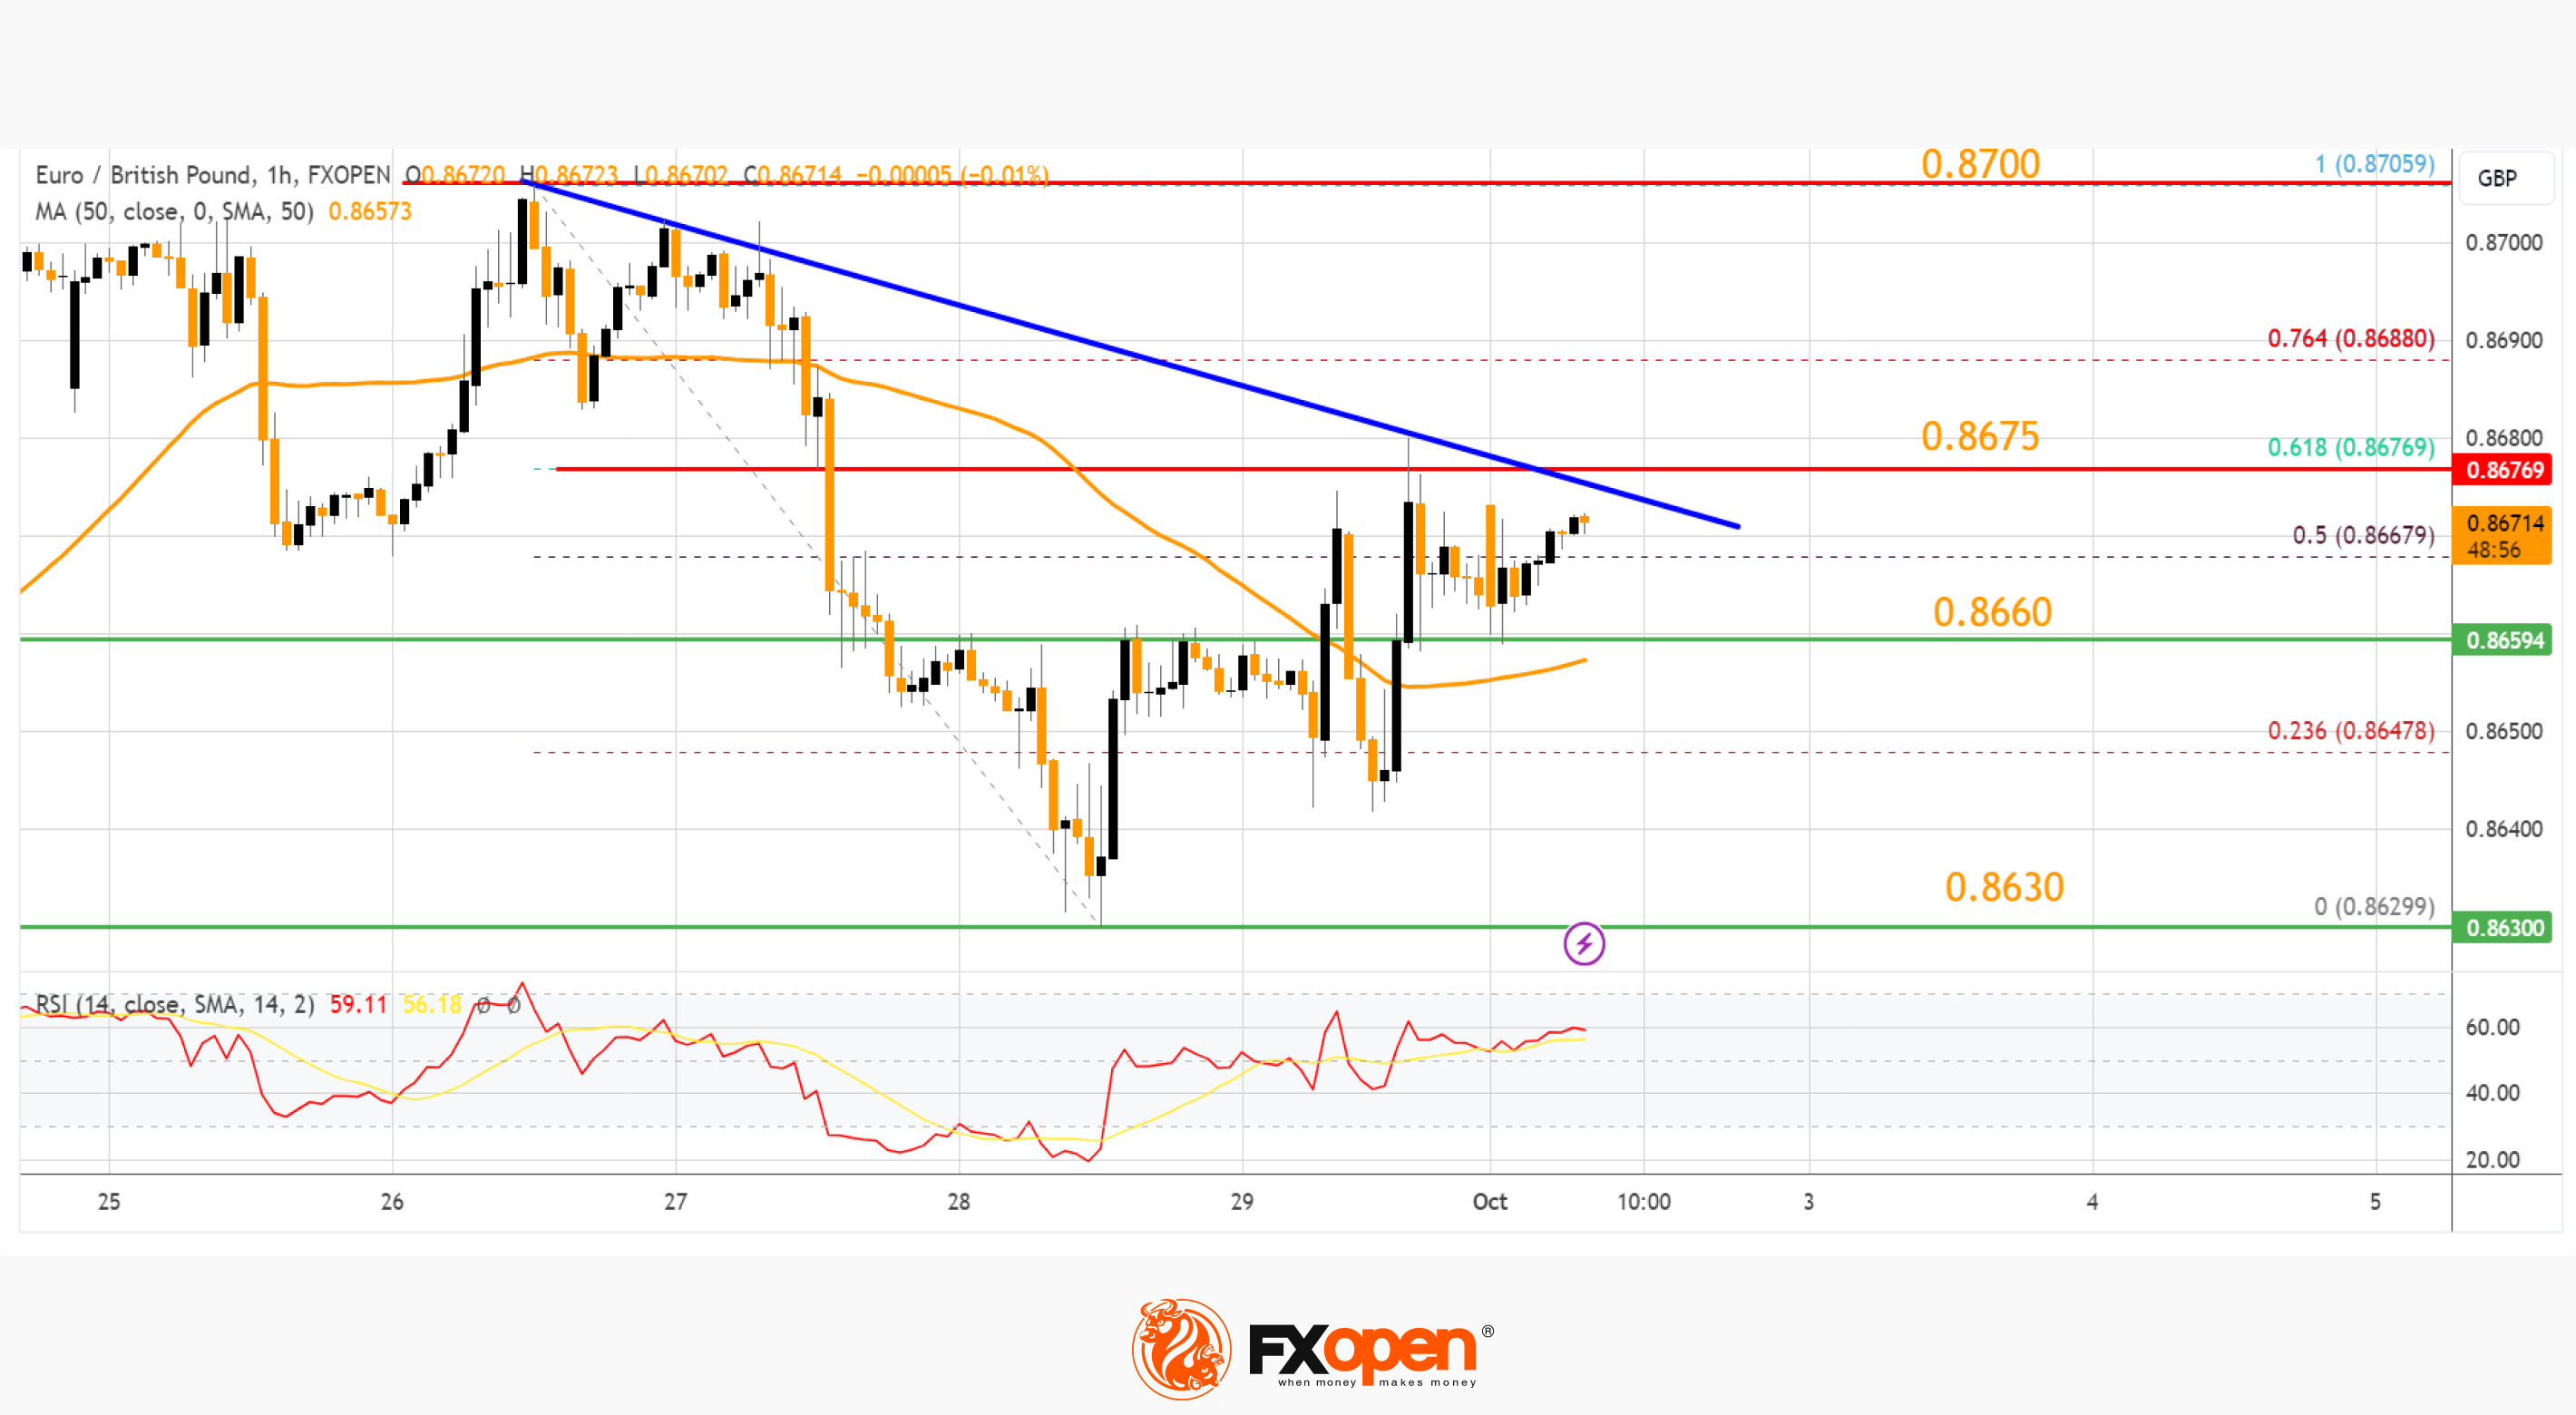
Immediate resistance is near a major bearish trend line at 0.8675. It coincides with the 61.8% Fib retracement level of the last main decline from the 0.8705 swing high to the 0.8629 low.
The next major resistance could be 0.8700. A close above the 0.8700 level might accelerate gains. In the stated case, the bulls may perhaps aim for a test of 0.8750. Any more gains might send the pair toward the 0.8800 level.
Immediate support sits near the 50-hour simple moving average at 0.8660. The next major support is near 0.8630. A downside break below the 0.8630 support might call for more downsides. In the stated case, the pair could drop toward the 0.8600 support level.
Trade over 50 forex markets 24 hours a day with FXOpen. Take advantage of low commissions, deep liquidity, and spreads from 0.0 pips (additional fees may apply). Open your FXOpen account now or learn more about trading forex with FXOpen.
This article represents the opinion of the Companies operating under the FXOpen brand only. It is not to be construed as an offer, solicitation, or recommendation with respect to products and services provided by the Companies operating under the FXOpen brand, nor is it to be considered financial advice.
Stay ahead of the market!
Subscribe now to our mailing list and receive the latest market news and insights delivered directly to your inbox.


Latest articles

USD/JPY: Battling at the Top of the Triangle
On 3 July, Japan's Finance Minister, Satsuki Katayama, stated that the Ministry of Finance remains in close contact with US authorities regarding developments in USD/JPY as the yen traded near its weakest level in almost 40 years. Similar verbal

Dow Jones (DJIA): Consolidation Beyond the Trend
Federal Reserve Chair Kevin Warsh testified before Congress on 14–15 July, reaffirming the Fed's commitment to bringing inflation back to target while providing no clear guidance on the future path of interest rates. Meanwhile, June inflation data came in

European Currencies Strengthen Ahead of Key Macroeconomic Releases
EUR/USD and GBP/USD continue to recover moderately following the recent weakening of the US dollar. European currencies have been supported by expectations that US inflationary pressures will continue to ease after softer-than-expected CPI and PPI data, reinforcing market