


FXOpen

GBP/USD failed to climb above 1.3575 and corrected some gains. EUR/GBP started a decent increase and might aim for more gains above 0.8800.
Important Takeaways for GBP/USD and EUR/GBP Analysis Today
· The British Pound is showing bearish signs below the 1.3500 support.
· There is a key bearish trend line forming with resistance near 1.3440 on the hourly chart of GBP/USD at FXOpen.
· EUR/GBP is gaining pace and trading above the 0.8750 pivot level.
· There is a connecting bullish trend line forming with support at 0.8755 on the hourly chart at FXOpen.
GBP/USD Technical Analysis
On the hourly chart of GBP/USD at FXOpen, the pair failed to stay above the 1.3535 pivot level. As a result, the British Pound started a fresh decline below 1.3500 against the US Dollar.
There was a clear move below 1.3485 and the 50-hour simple moving average. The bears pushed the pair below 1.3440. Finally, there was a spike toward the 1.3400 handle. A low was formed near 1.3400, and the pair is now consolidating losses.
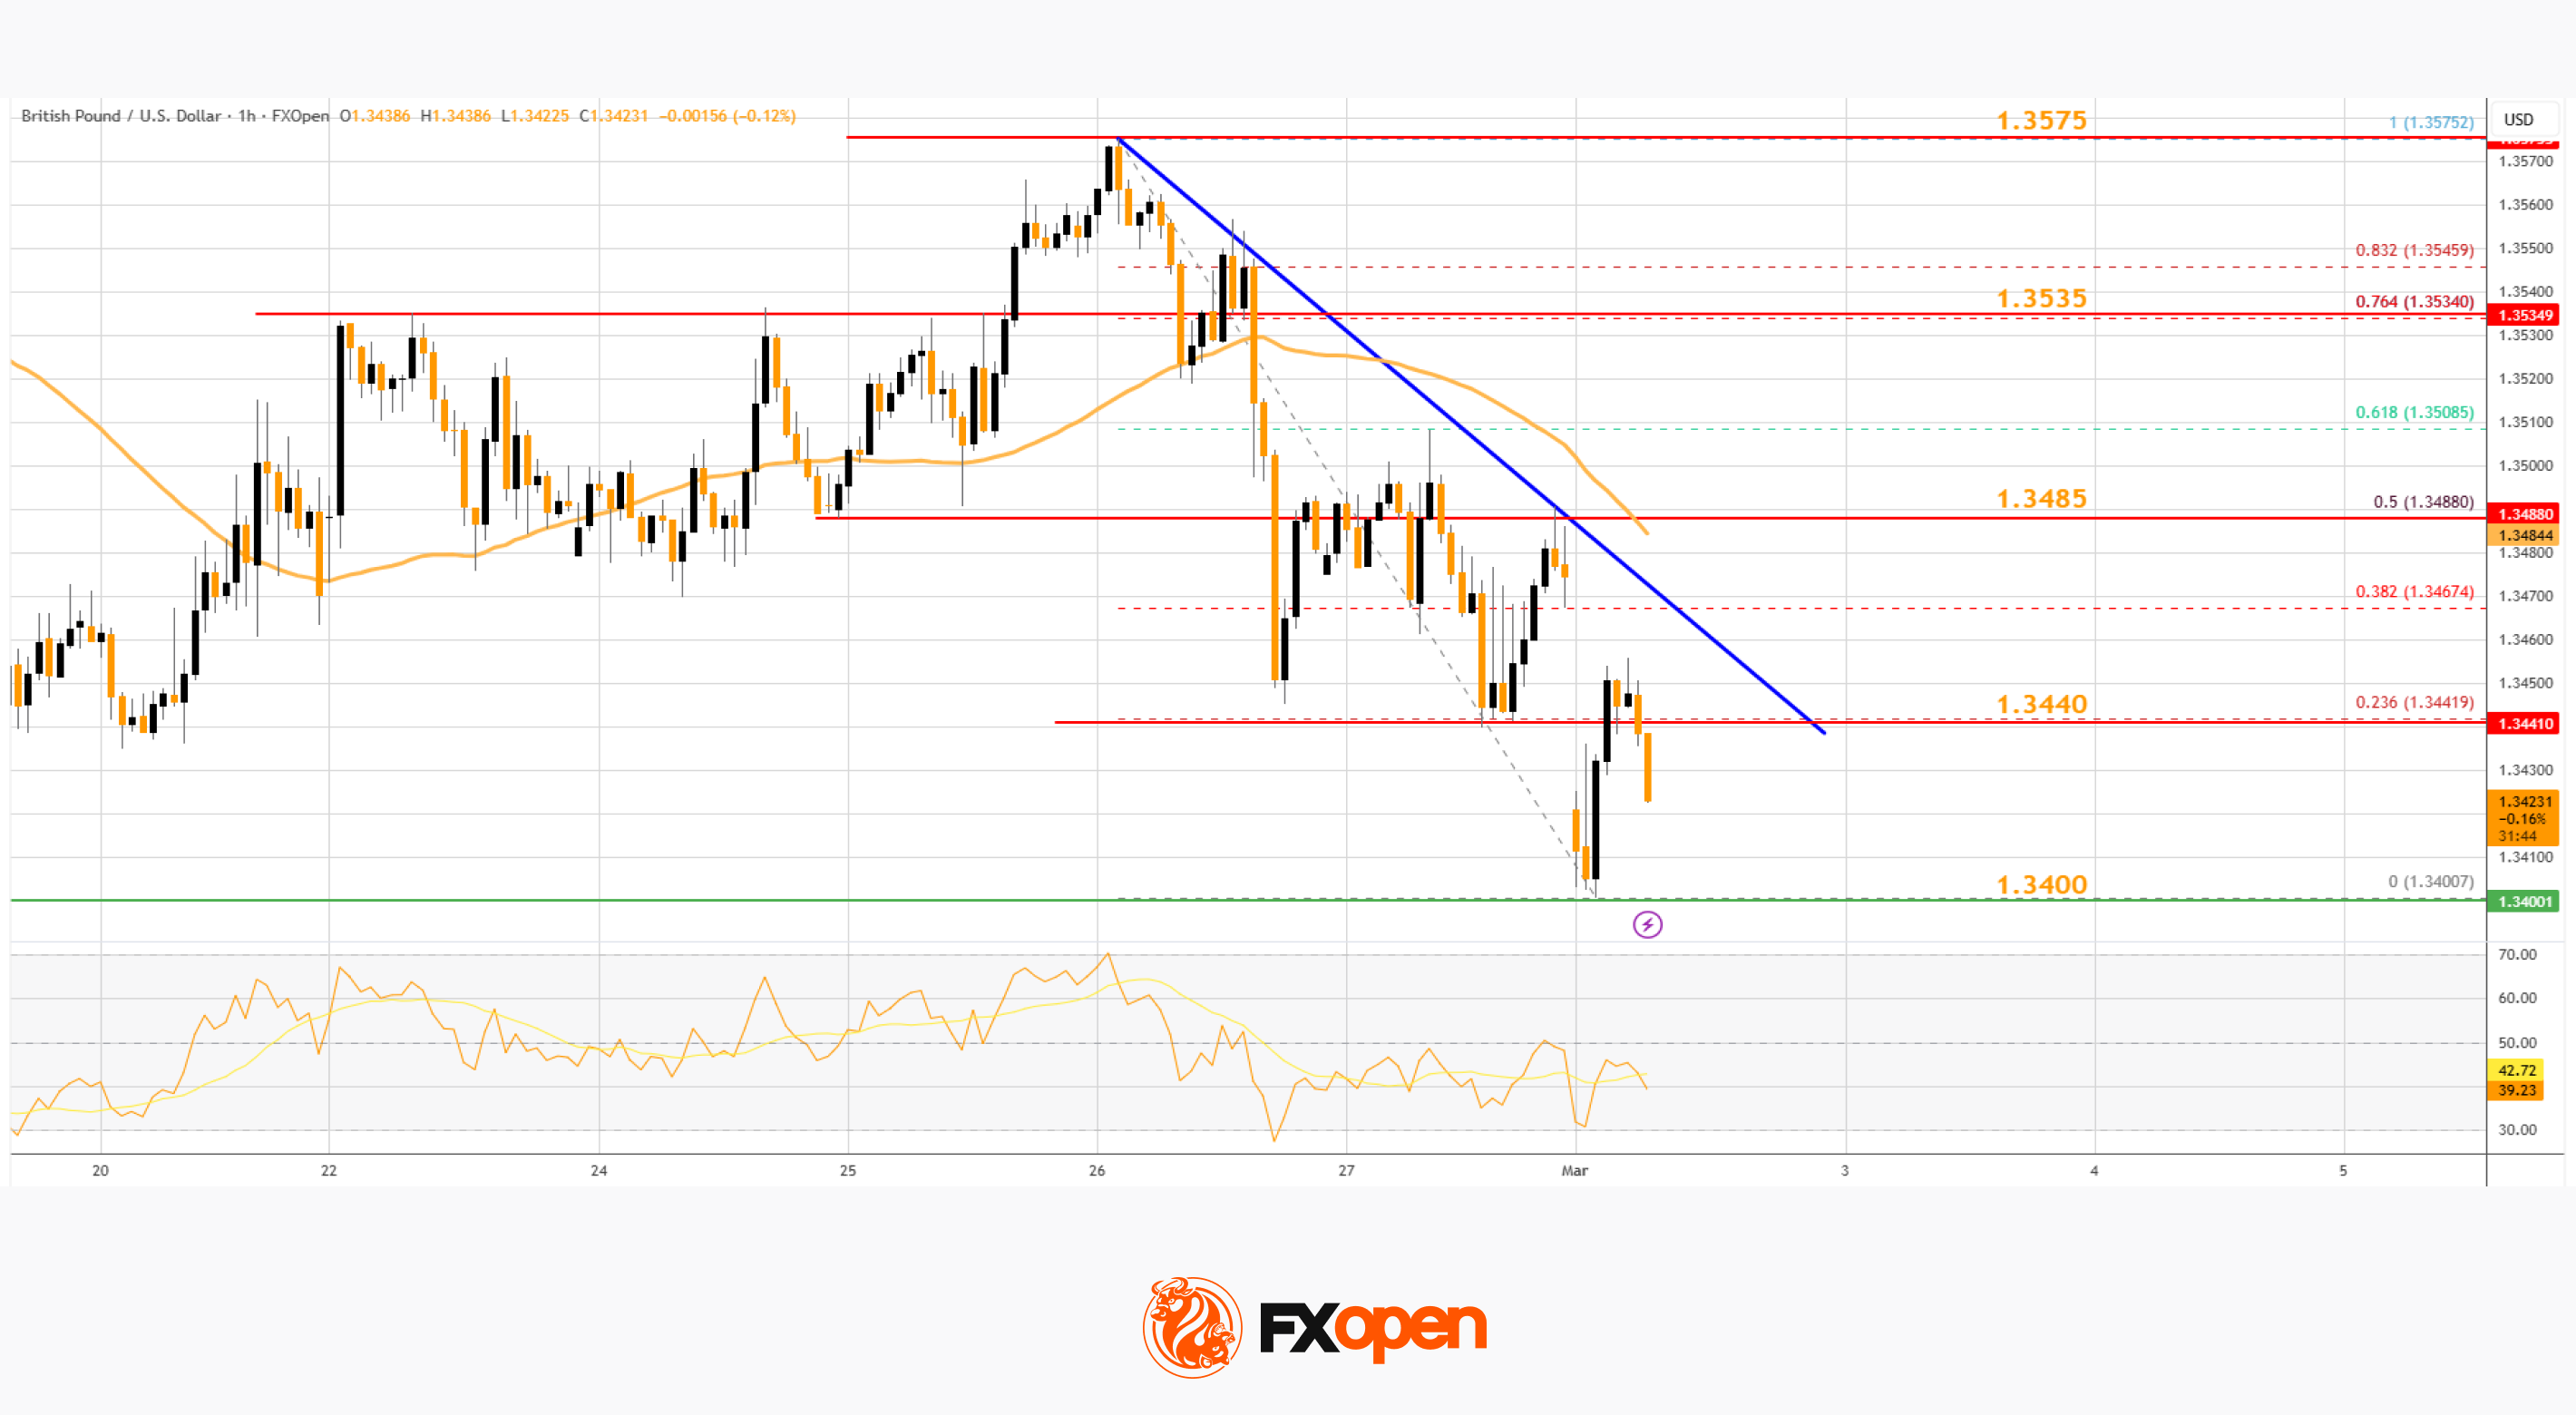
There was a minor move above 1.3425 and the 23.6% Fib retracement level of the downward move from the 1.3575 swing high to the 1.3400 low. On the upside, the GBP/USD chart indicates that the pair is facing resistance near a key bearish trend line at 1.3440.
A close above the trend line might send the pair toward the 50% Fib retracement at 1.3485 and the 50-hour simple moving average. If the bulls remain in action, they could aim for more gains.
In the stated case, the pair might rise toward 1.3535. The next major hurdle for GBP/USD sits at 1.3575. On the downside, there is a key support forming near 1.3400. If there is a downside break below 1.3400, the pair could accelerate lower. The next key interest area might be 1.3360, below which the pair could test 1.3320. Any more downside could lead the pair toward 1.3250.
EUR/GBP Technical Analysis
On the hourly chart of EUR/GBP at FXOpen, the pair started a decent increase from 0.8700. The Euro traded above 0.8750 to enter a positive zone against the British Pound.
The pair settled above the 50-hour simple moving average and 0.8760. The pair traded as high as 0.8789 before there was a downside correction. There was a move below the 23.6% Fib retracement level of the upward move from the 0.8702 swing low to the 0.8790 high.
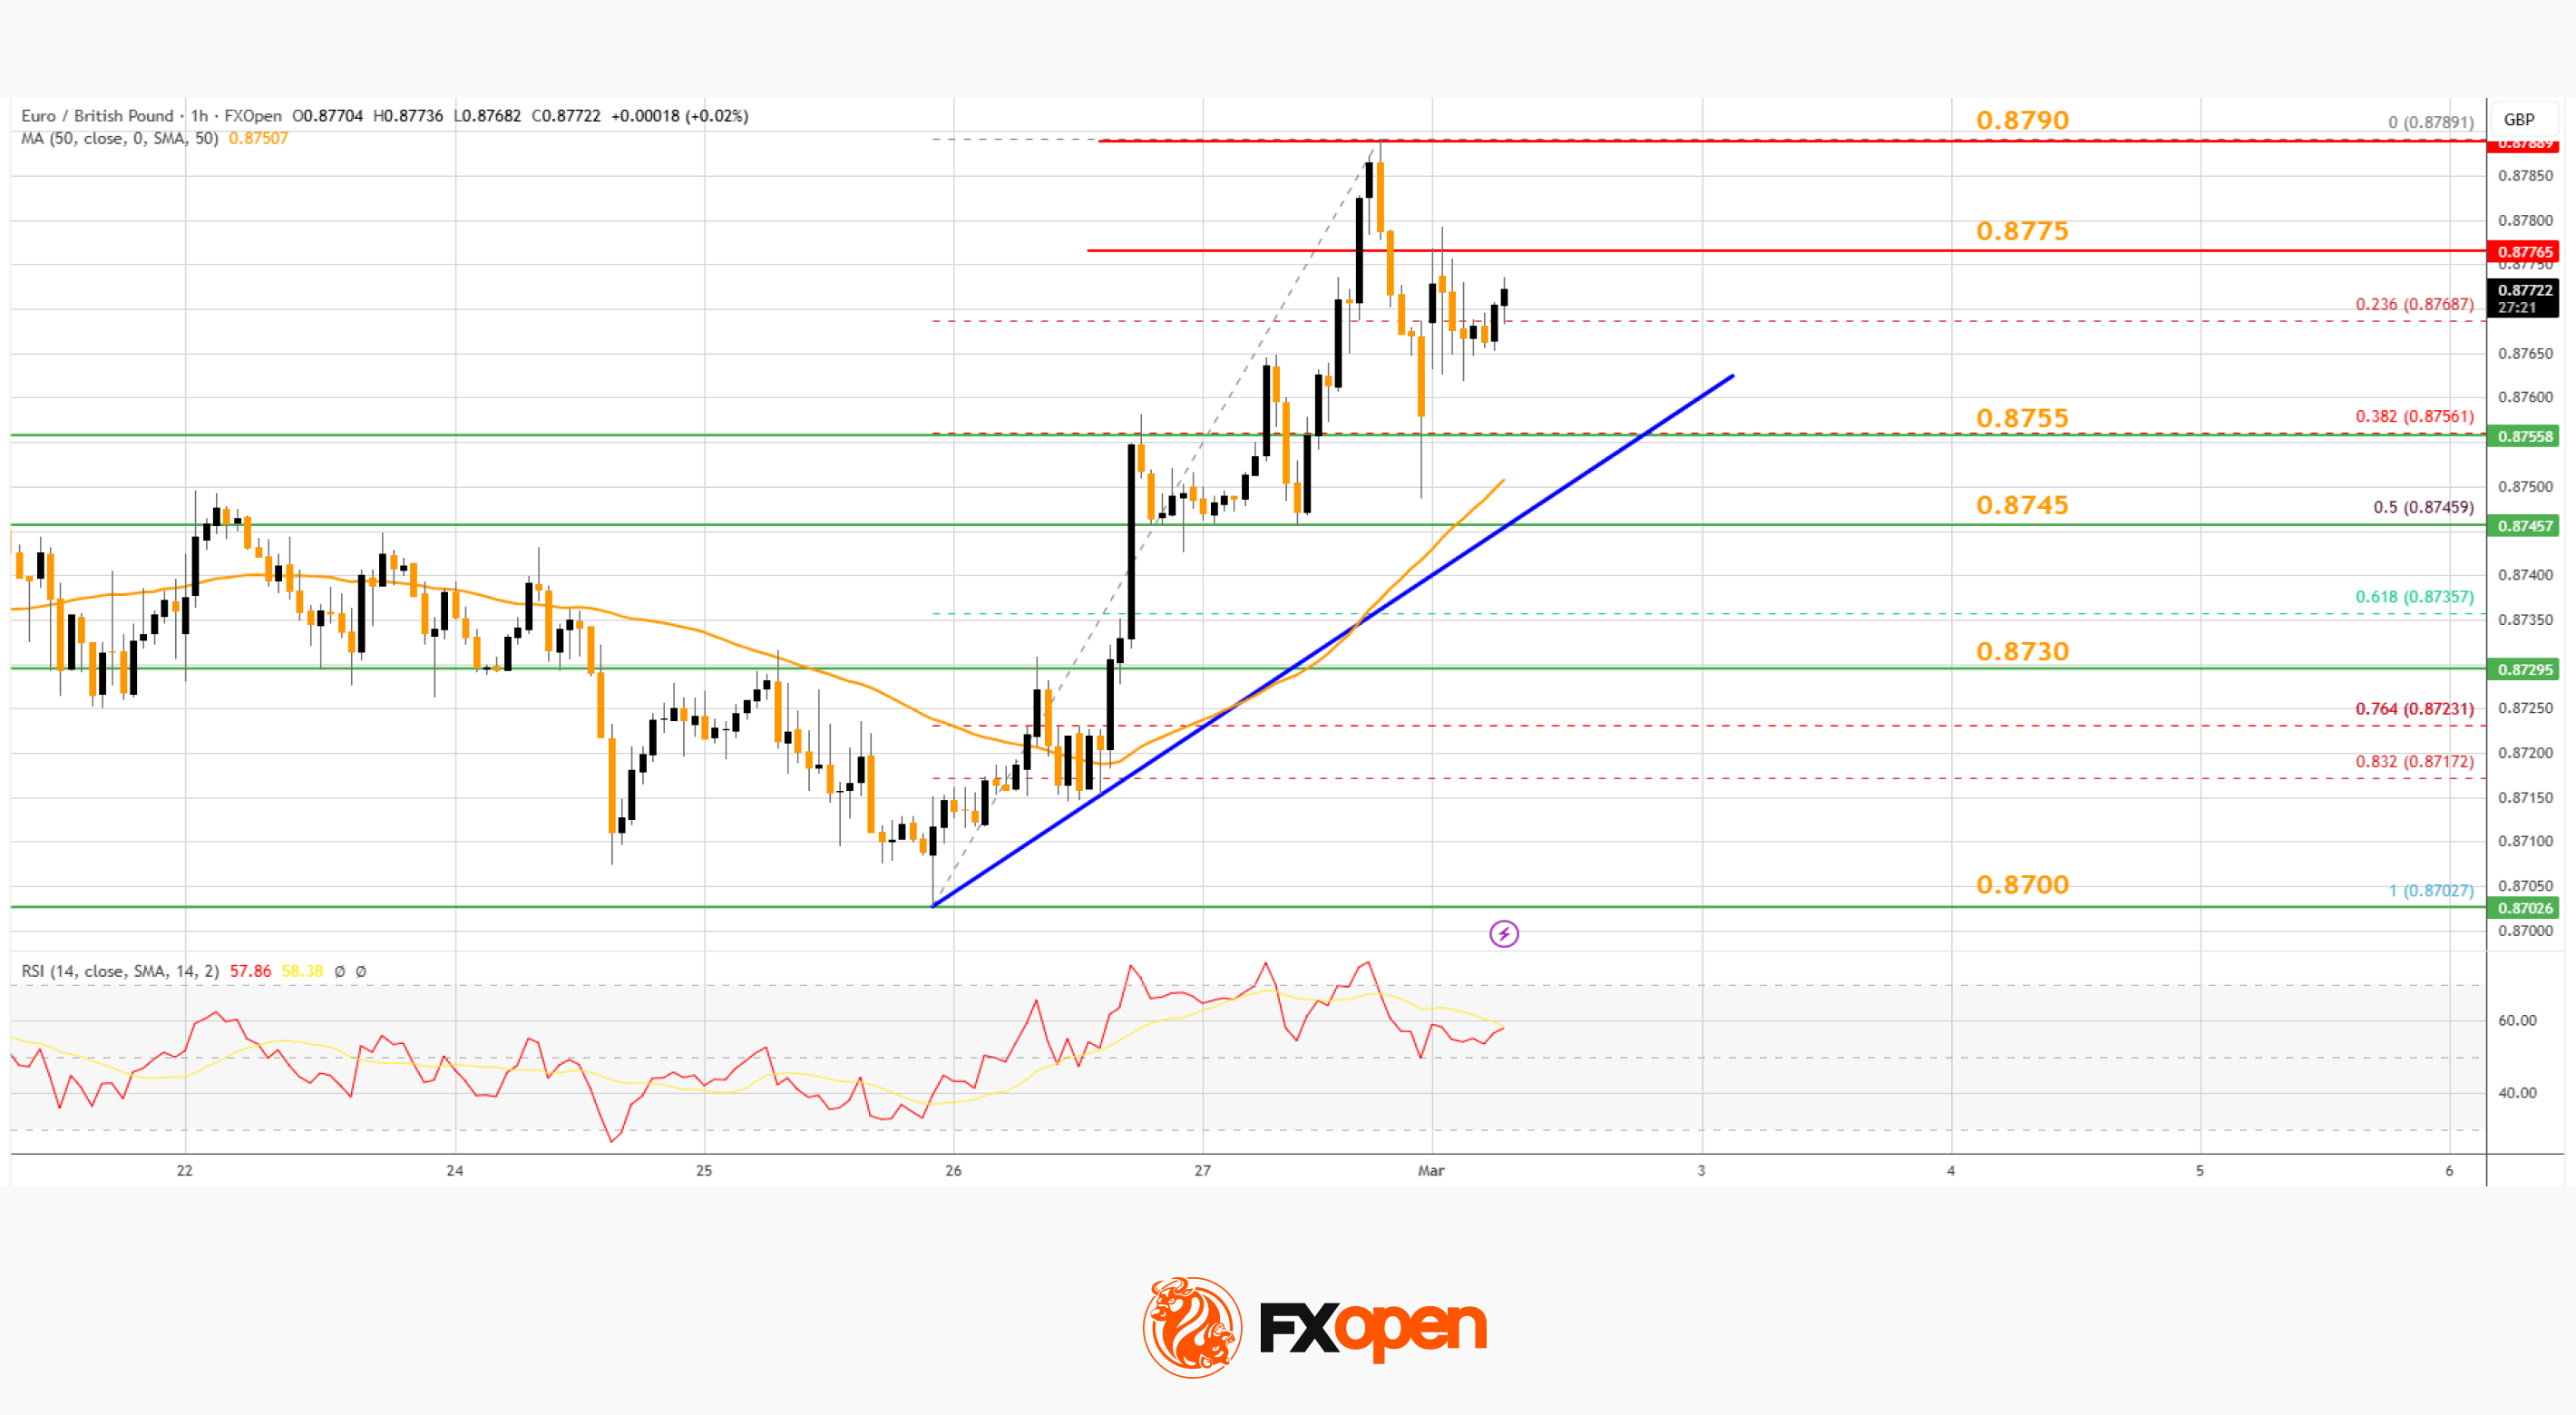
However, the pair is stable above 0.8750 and the 50% Fib retracement. Besides, there is a connecting bullish trend line forming with support at 0.8755.
A downside break below 0.8755 might call for more downsides. In the stated case, the pair could drop toward 0.8745. Any more losses might call for an extended drop toward the 0.8730 pivot zone.
If there is another increase, the EUR/GBP chart suggests that the pair is facing hurdles near 0.8775. A close above 0.8775 might accelerate gains. In the stated case, the bulls may perhaps aim for a test of 0.8800. Any more gains might send the pair to 0.8840.
Trade over 50 forex markets 24 hours a day with FXOpen. Take advantage of low commissions, deep liquidity, and spreads from 0.0 pips (additional fees may apply). Open your FXOpen account now or learn more about trading forex with FXOpen.
This article represents the opinion of the Companies operating under the FXOpen brand only. It is not to be construed as an offer, solicitation, or recommendation with respect to products and services provided by the Companies operating under the FXOpen brand, nor is it to be considered financial advice.
Stay ahead of the market!
Subscribe now to our mailing list and receive the latest market news and insights delivered directly to your inbox.


Latest articles
Weekend Trading: Market Access, Liquidity, and Trading Conditions
Weekend trading refers to market activity outside

AUD/USD Falls Below Key Support
As the AUD/USD chart indicates, the Australian dollar is showing weakness against the US dollar at the start of the week. Notably, we are seeing a bearish breakout below the lower boundary of an important ascending channel that had

Gold Price Falls to 2026 Low
As the XAU/USD chart indicates, today, shortly after the start of the trading week, gold fell below $4,150 (the low of the year). The last time prices were at this level was in early December 2025, before the