


FXOpen

Gold price started a fresh increase above the $2,342 resistance level. Crude oil prices are gaining bullish momentum and might soon test $85.00.
Important Takeaways for Gold and Oil Prices Analysis Today
· Gold price started a steady increase from the $2,320 zone against the US Dollar.
· A connecting bullish trend line is forming with support near $2,355 on the hourly chart of gold at FXOpen.
· Crude oil prices extended gains above the $82.00 and $83.00 resistance levels.
· There is a key bullish trend line forming with support at $82.75 on the hourly chart of XTI/USD at FXOpen.
Gold Price Technical Analysis
On the hourly chart of Gold at FXOpen, the price found support near the $2,320 zone. The price formed a base and started a fresh increase above the $2,330 level.
There was a decent move above the 50-hour simple moving average and $2,335. The bulls pushed the price above the $2,355 resistance zone. Finally, the bears appeared near $2,365. A high was formed near $2,364.89 and the price is now consolidating gains.
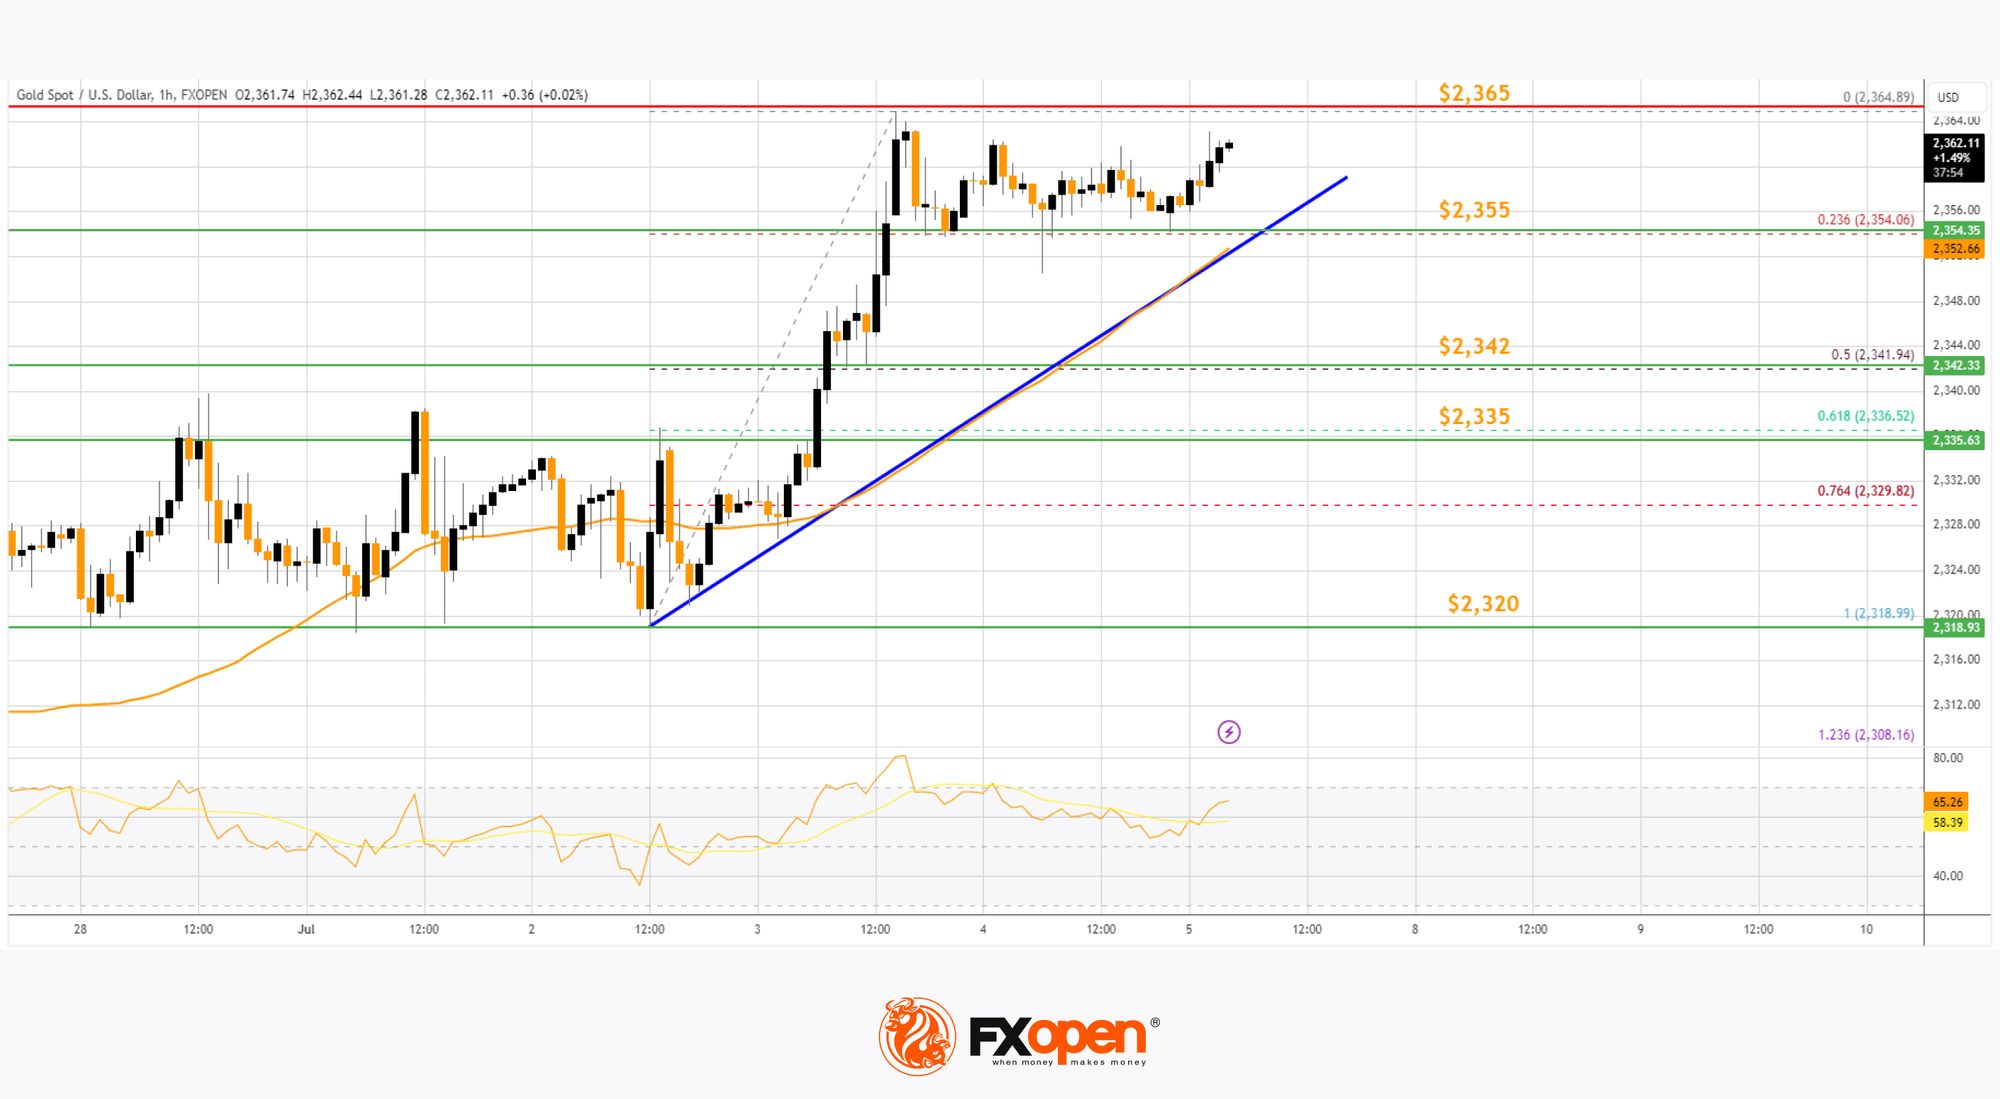
The price dipped a few points and tested the 23.6% Fib retracement level of the upward move from the $2,319 swing low to the $2,365 high. The RSI is still above 55 and the price could aim for more gains.
Immediate resistance is near the $2,365 level. The next major resistance is near the $2,372 level. An upside break above the $2,372 resistance could send Gold price toward $2,380. Any more gains may perhaps set the pace for an increase toward the $2,400 level.
Initial support on the downside is near the $2,355 zone. There is also a connecting bullish trend line forming with support near $2,355. If there is a downside break below the $2,355 support, the price might decline further.
In the stated case, the price might drop toward the $2,335 support or the 61.8% Fib retracement level of the upward move from the $2,319 swing low to the $2,365 high. The next major support sits at $2,320.
Read analytical Gold price forecasts for 2024 and beyond.
Oil Price Technical Analysis
On the hourly chart of WTI Crude Oil at FXOpen, the price started a major upward move from $80.45 against the US Dollar. The price gained bullish momentum after it broke the $82.00 resistance.
The bulls pushed the price above the $82.30 and $82.75 resistance levels. The recent high was formed at $83.50 and the price settled above the 50-hour simple moving average. The RSI is now near the 50 level and the price is trading below the 23.6% Fib retracement level of the upward move from the $81.95 swing low to the $83.52 high.
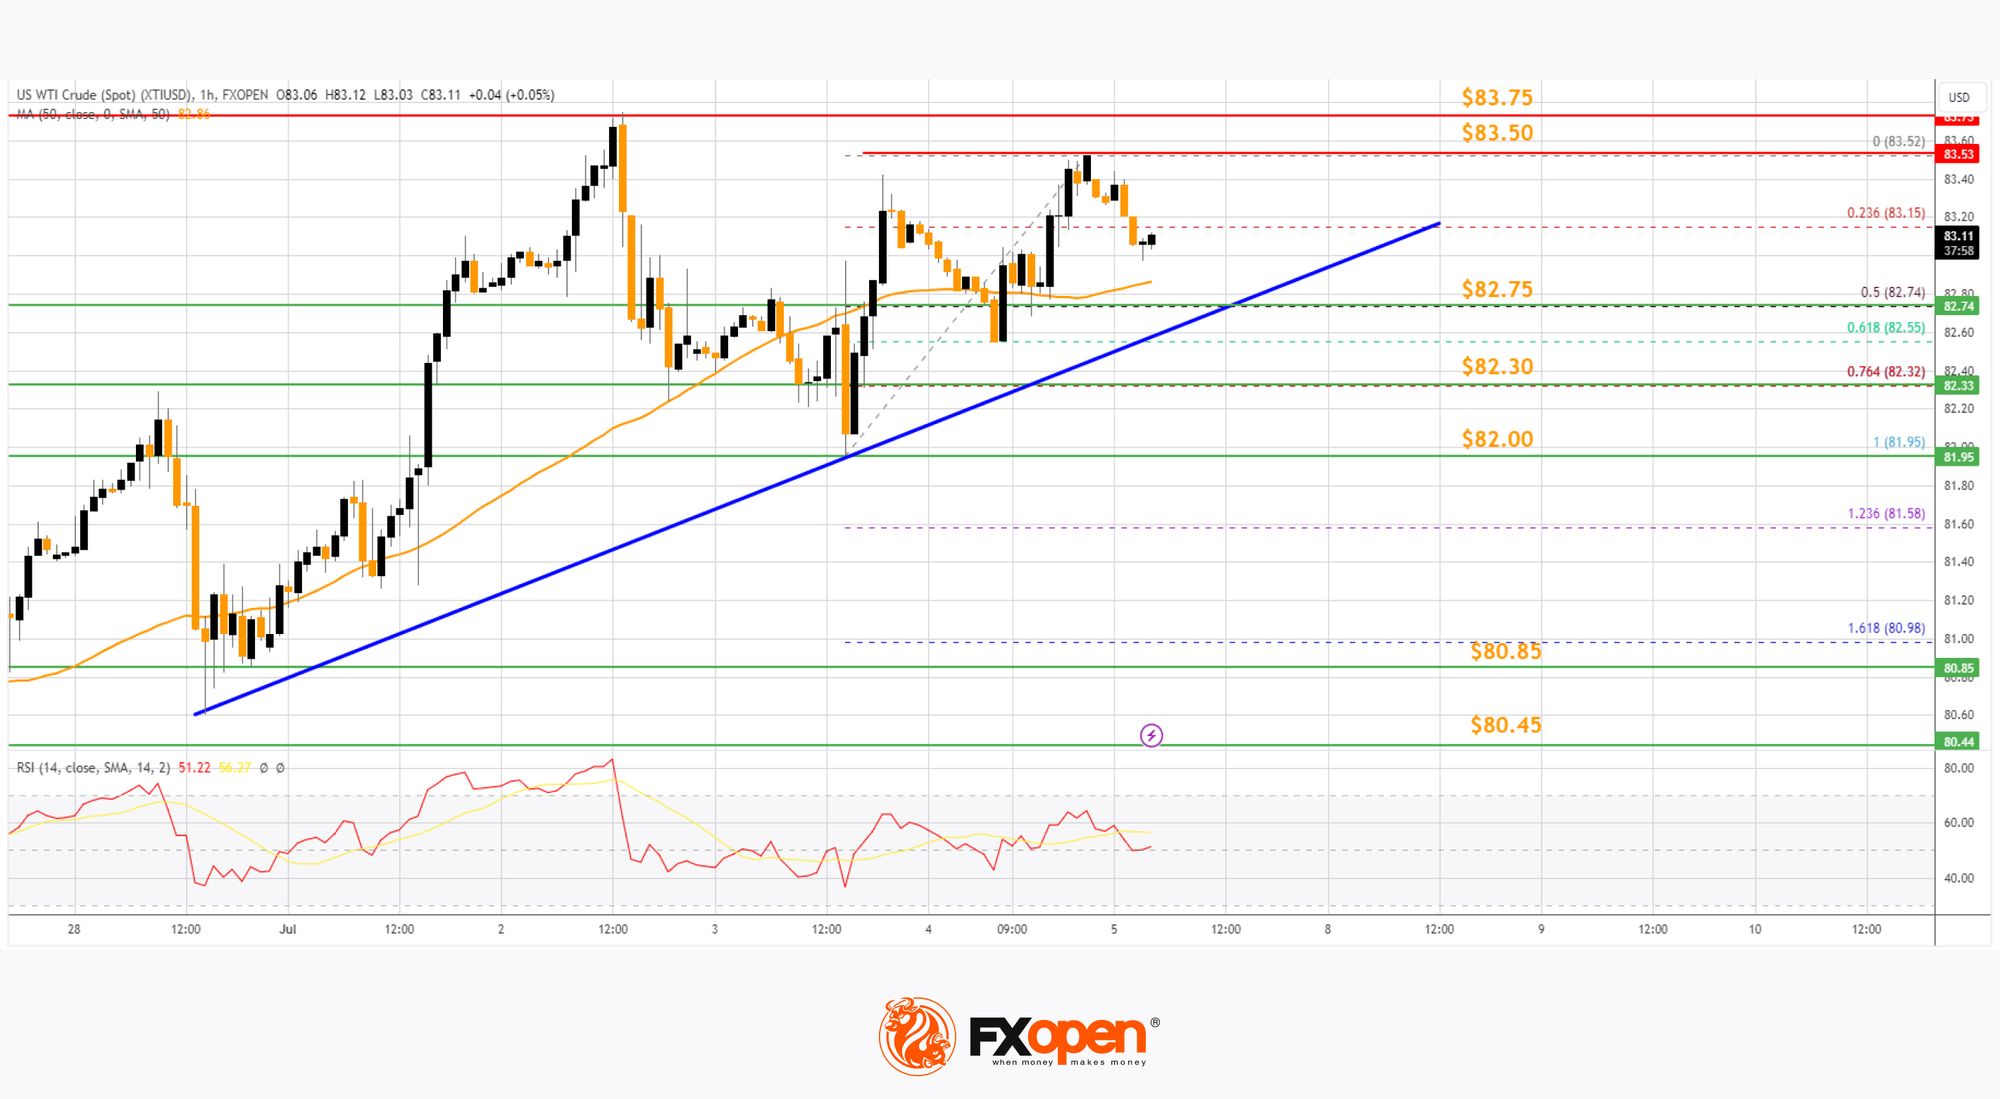
If the price climbs higher again, it could face resistance near $83.50. The next major resistance is near the $83.75 level. Any more gains might send the price toward the $85.00 level.
Conversely, the price might correct gains and test the 50% Fib retracement level of the upward move from the $81.95 swing low to the $83.52 high at $82.75. There is also a key bullish trend line forming with support at $82.75.
The next major support on the WTI crude oil chart is near the $82.30 zone, below which the price could test the $82.00 zone. If there is a downside break, the price might decline toward $80.85. Any more losses may perhaps open the doors for a move toward the $78.50 support zone.
Start trading commodity CFDs with tight spreads (additional fees may apply). Open your trading account now or learn more about trading commodity CFDs with FXOpen.
This article represents the opinion of the Companies operating under the FXOpen brand only. It is not to be construed as an offer, solicitation, or recommendation with respect to products and services provided by the Companies operating under the FXOpen brand, nor is it to be considered financial advice.
Stay ahead of the market!
Subscribe now to our mailing list and receive the latest market news and insights delivered directly to your inbox.


Latest articles

European Currencies Decline: Pound Hits New Lows, Euro Under Pressure
European currencies continue to weaken against the US dollar amid rising geopolitical tensions and increased demand for safe-haven and liquid assets. Market participants are reducing exposure to riskier instruments, putting pressure on both the euro and the pound. Additional support

Market Analysis: GBP/USD Dips Further As EUR/GBP Regains Traction
GBP/USD failed to climb above 1.3500 and corrected some gains. EUR/GBP started a decent increase and might aim for more gains above 0.8700.
Important Takeaways for GBP/USD and EUR/GBP Analysis Today
· The British Pound
