


FXOpen

Gold price started a fresh increase above the $2,618 resistance level. WTI Crude oil prices are gaining bullish momentum and might even test $78.00.
Important Takeaways for Gold and WTI Crude Oil Prices Analysis Today
· Gold price started a steady increase from the $2,600 zone against the US Dollar.
· It cleared a key bearish trend line with resistance at $2,630 on the hourly chart of gold at FXOpen.
· WTI Crude oil prices extended gains above the $72.40 and $73.50 resistance levels.
· There was a move above a connecting bearish trend line with resistance at $72.75 on the hourly chart of XTI/USD at FXOpen.
Gold Price Technical Analysis
On the hourly chart of Gold at FXOpen, the price found support near the $2,600 zone. The price formed a base and started a fresh increase above the $2,618 level.
The bulls cleared a key bearish trend line with resistance at $2,630 and the 50-hour simple moving average. There was a clear move above the 50% Fib retracement level of the downward move from the $2,670 swing high to the $2,602 low.
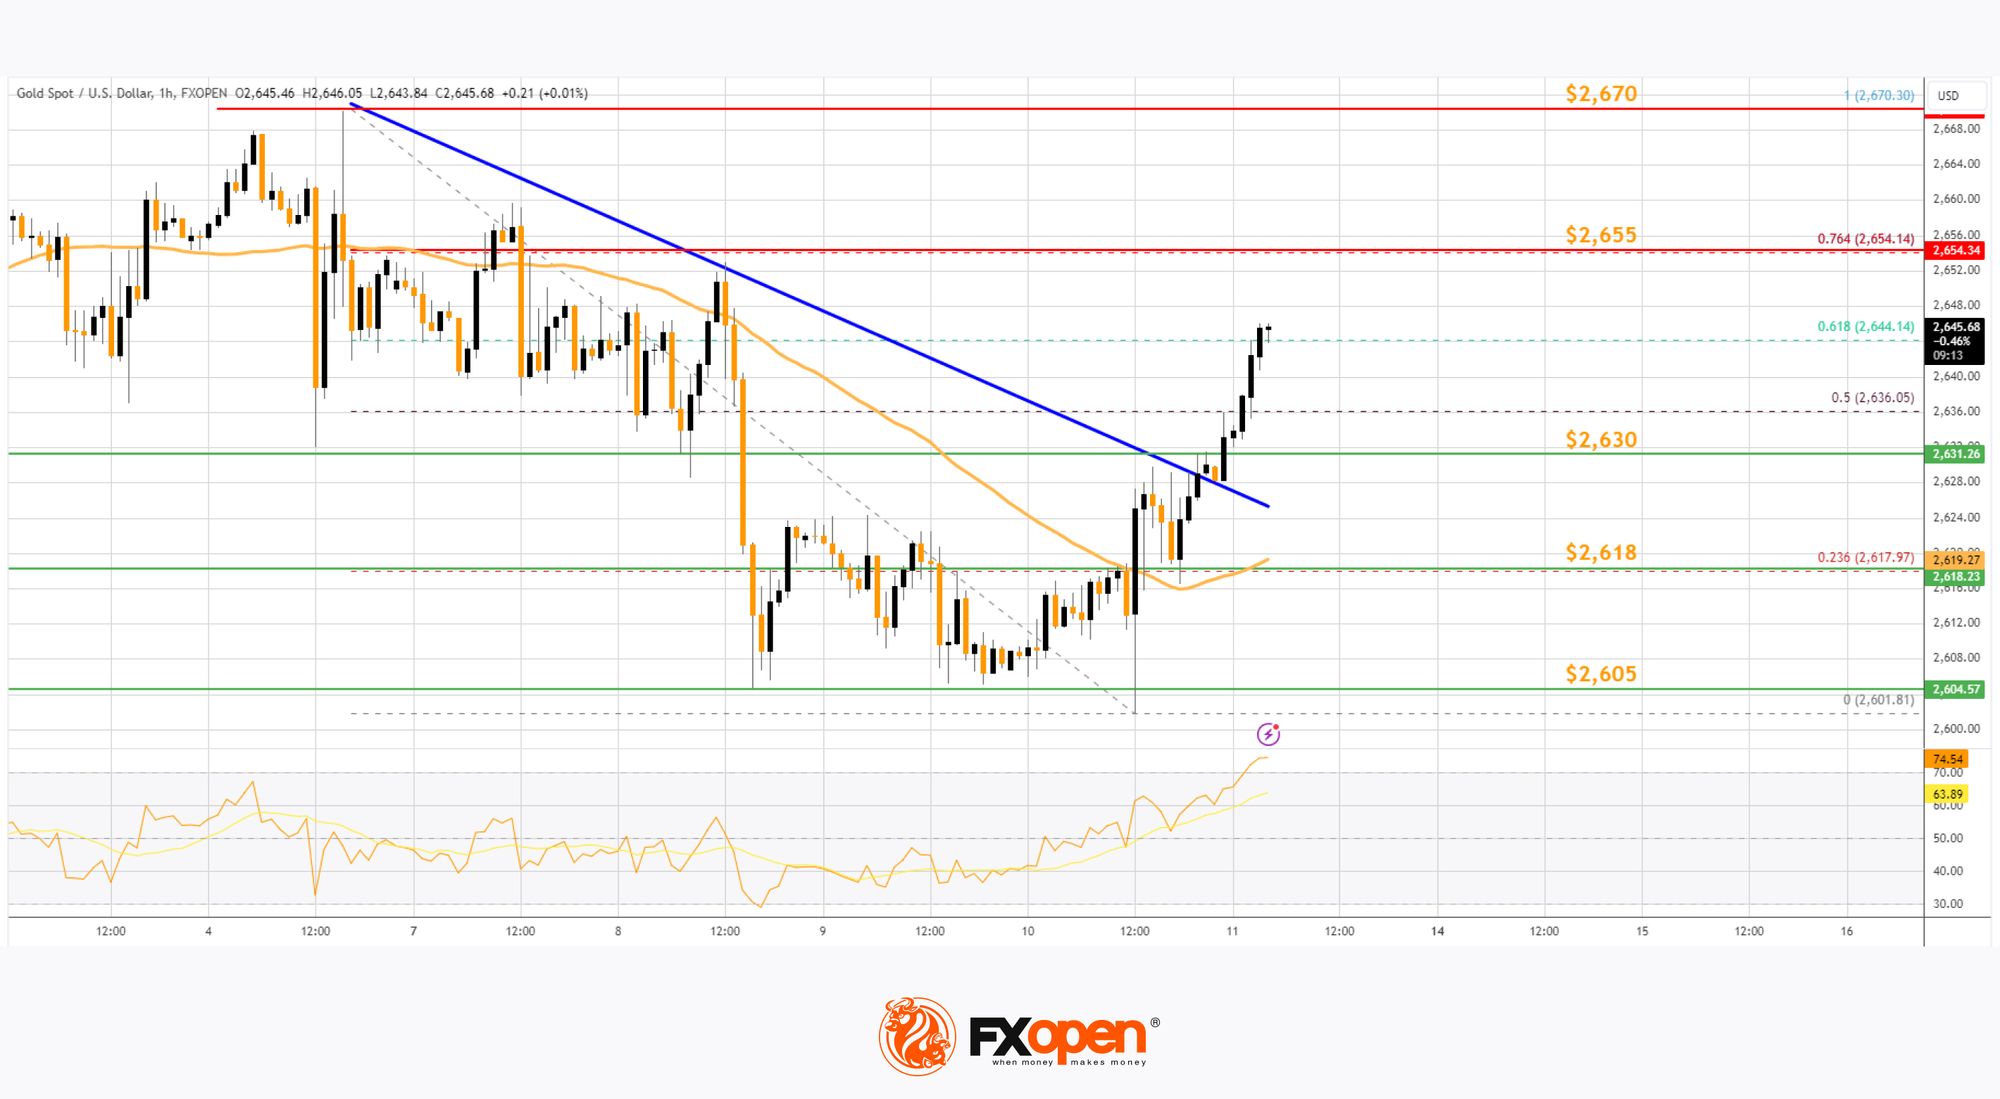
The RSI is now well above 60 and the price could aim for more gains. Immediate resistance is near the 76.4% Fib retracement level of the downward move from the $2,670 swing high to the $2,602 low at $2,655.
The next major resistance is near the $2,670 level. An upside break above the $2,670 resistance could send Gold price toward $2,690. Any more gains may perhaps set the pace for an increase toward the $2,700 level.
Initial support on the downside is near the $2,630 zone. If there is a downside break below the $2,630 support, the price might decline further.
In the stated case, the price might drop toward the $2,618 support. The next major support sits at $2,605. Any more losses might send the price toward the $2,585 level.
WTI Crude Oil Price Technical Analysis
On the hourly chart of WTI Crude Oil at FXOpen, the price started a fresh upward move from $71.15 against the US Dollar. The price gained bullish momentum after it broke the $72.40 resistance.
The bulls pushed the price above the 50% Fib retracement level of the downward move from the $77.89 swing high to the $71.16 low. Besides, there was a move above a connecting bearish trend line with resistance at $72.75.
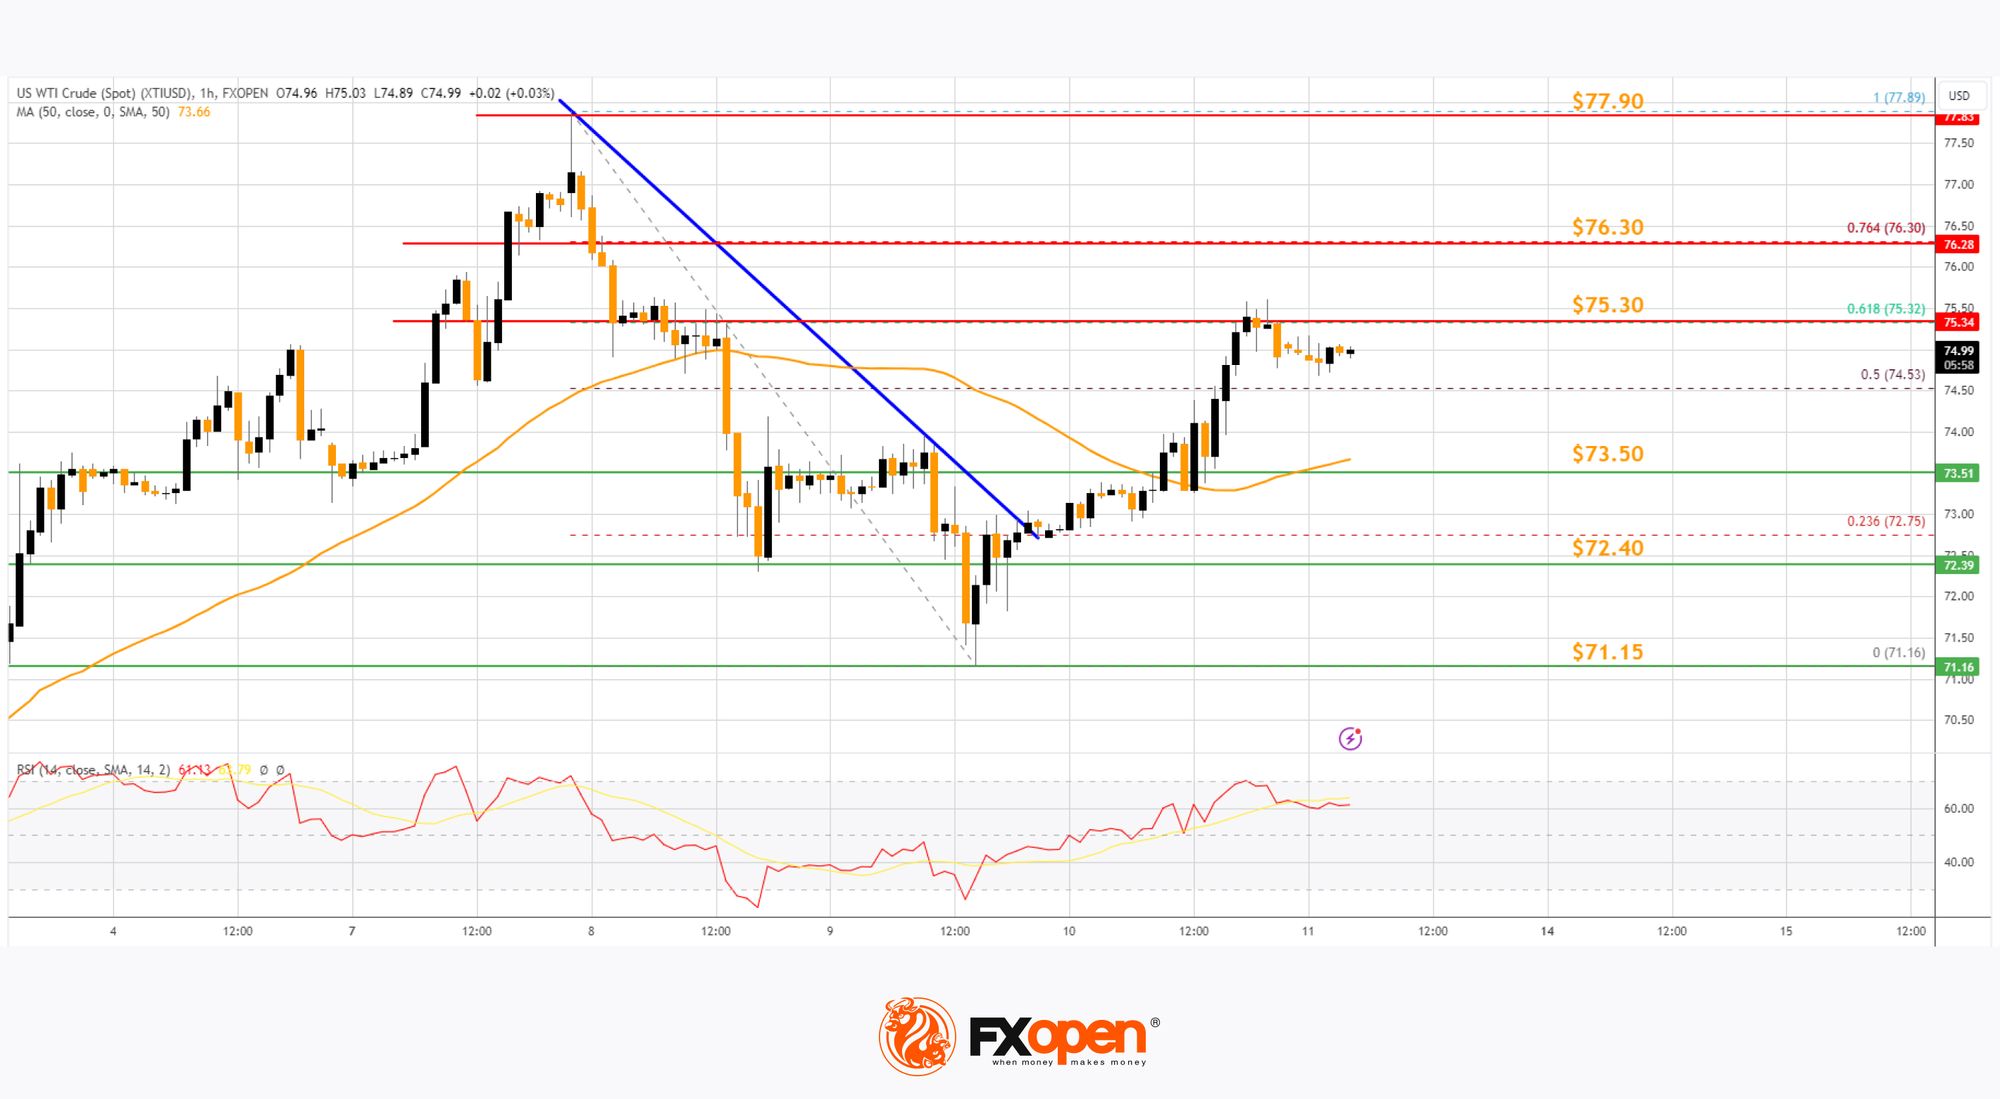
The price even climbed above the 50-hour simple moving average. It tested the $75.30 resistance zone and the 61.8% Fib retracement level of the downward move from the $77.89 swing high to the $71.16 low.
The RSI is now near the 60 level and the price could aim for more gains. If the price climbs higher again, it could face resistance near $76.30. The next major resistance is near the $77.90 level. Any more gains might send the price toward the $79.50 level or even $80.00.
Conversely, the price might correct gains and test the $73.50 level. The next major support on the WTI crude oil chart is near the $72.40 zone, below which the price could test the $71.15 zone.
If there is a downside break, the price might decline toward $70.00. Any more losses may perhaps open the doors for a move toward the $68.50 support zone.
Start trading commodity CFDs with tight spreads (additional fees may apply). Open your trading account now or learn more about trading commodity CFDs with FXOpen.
This article represents the opinion of the Companies operating under the FXOpen brand only. It is not to be construed as an offer, solicitation, or recommendation with respect to products and services provided by the Companies operating under the FXOpen brand, nor is it to be considered financial advice.
Stay ahead of the market!
Subscribe now to our mailing list and receive the latest market news and insights delivered directly to your inbox.


Latest articles

Market Analysis: GBP/USD Dips Further As EUR/GBP Regains Traction
GBP/USD failed to climb above 1.3500 and corrected some gains. EUR/GBP started a decent increase and might aim for more gains above 0.8700.
Important Takeaways for GBP/USD and EUR/GBP Analysis Today
· The British Pound


Market Insights with Gary Thomson: Oil, US Retail Sales & NFP in Focus
In this video, we’ll explore the key economic events and market trends, shaping the financial landscape. Get ready for insights into financial markets to help you navigate the week ahead. Let’s dive in!
In this episode of Market