


Market Analysis: Gold Drop, Oil Slides — Traders Eye Macro Triggers
FXOpen

Gold price started a fresh decline below $3,320. WTI Crude oil is down over 15% and remains at risk of more losses.
Important Takeaways for Gold and WTI Crude Oil Price Analysis Today
- Gold price climbed higher toward the $3,400 zone before there was a sharp decline against the US Dollar.
- A key bearish trend line is forming with resistance near $3,300 on the hourly chart of gold at FXOpen.
- WTI Crude oil extended losses below the $68.00 support zone.
- A major bearish trend line is forming with resistance near $65.60 on the hourly chart of XTI/USD at FXOpen.
Technical Analysis of Gold Price
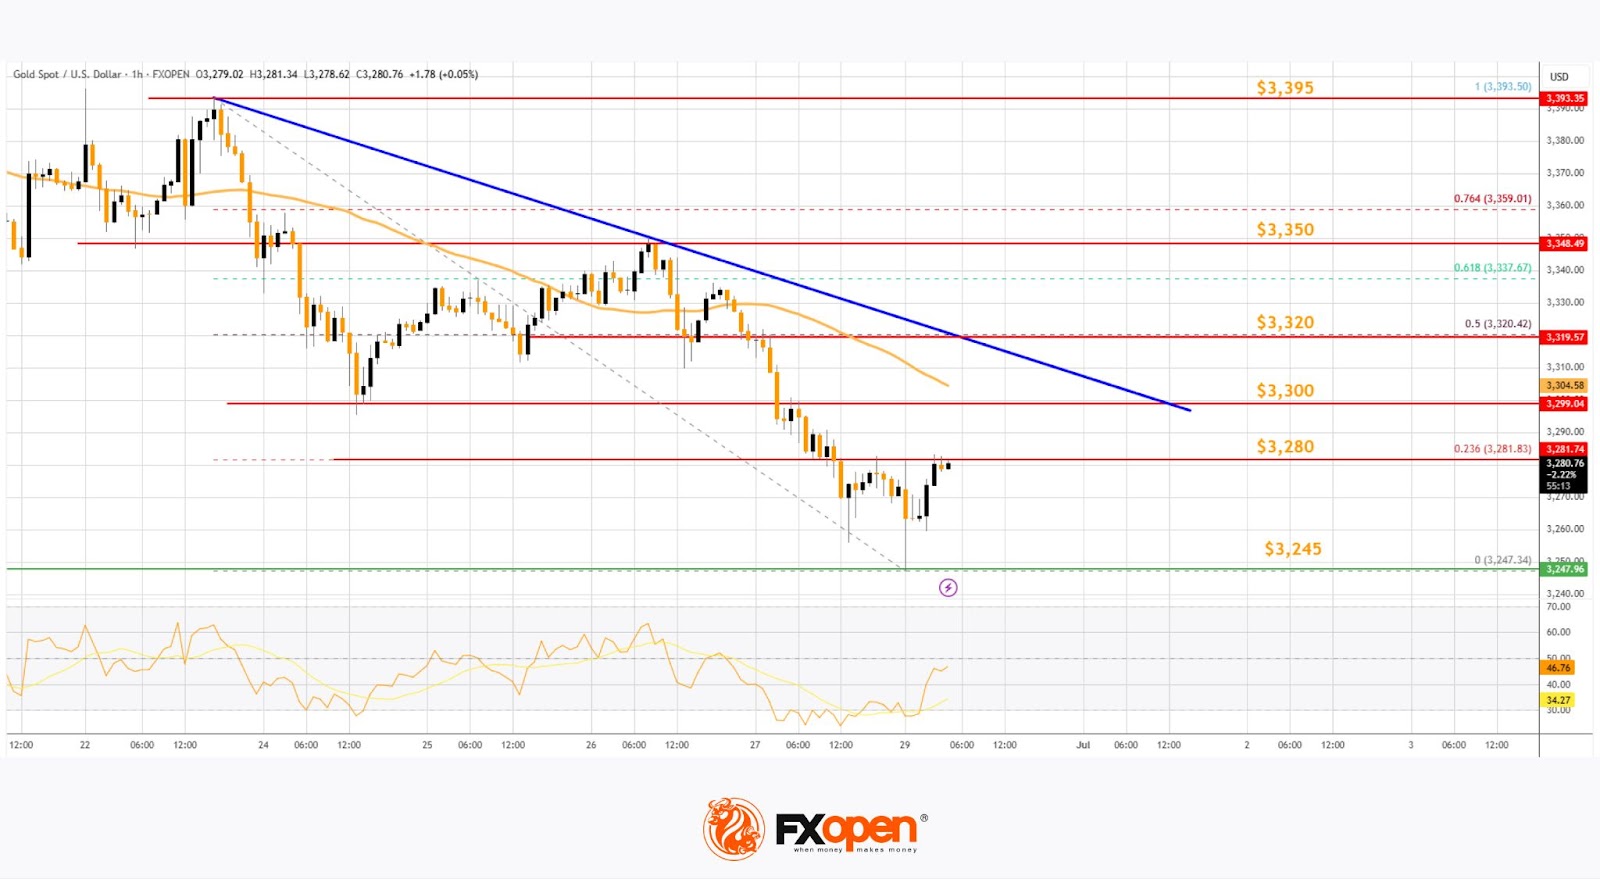
On the hourly chart of Gold at FXOpen, the price climbed above the $3,320 resistance. The price even spiked above $3,350 before the bears appeared.
A high was formed near $3,395 before there was a fresh decline. There was a move below the $3,350 support level. The bears even pushed the price below the $3,300 support and the 50-hour simple moving average.
It tested the $3,245 zone. A low is formed near $3,247 and the price is now showing bearish signs. There was a minor recovery wave toward the 23.6% Fib retracement level of the downward move from the $3,393 swing high to the $3,247 low.
However, the bears are active below $3,300. Immediate resistance is near $3,280. The next major resistance is near the $3,300 zone. There is also a key bearish trend line forming with resistance near $3,300.
The main resistance could be $3,320 or the 50% Fib retracement level, above which the price could test the $3,350 resistance. The next major resistance is $3,395.
An upside break above the $3,395 resistance could send Gold price toward $3,420. Any more gains may perhaps set the pace for an increase toward the $3,450 level.
Initial support on the downside is near the $3,245 level. The first major support is near the $3,220 level. If there is a downside break below the $3,220 support, the price might decline further. In the stated case, the price might drop toward the $3,200 support.
Technical Analysis of WTI Crude Oil Price
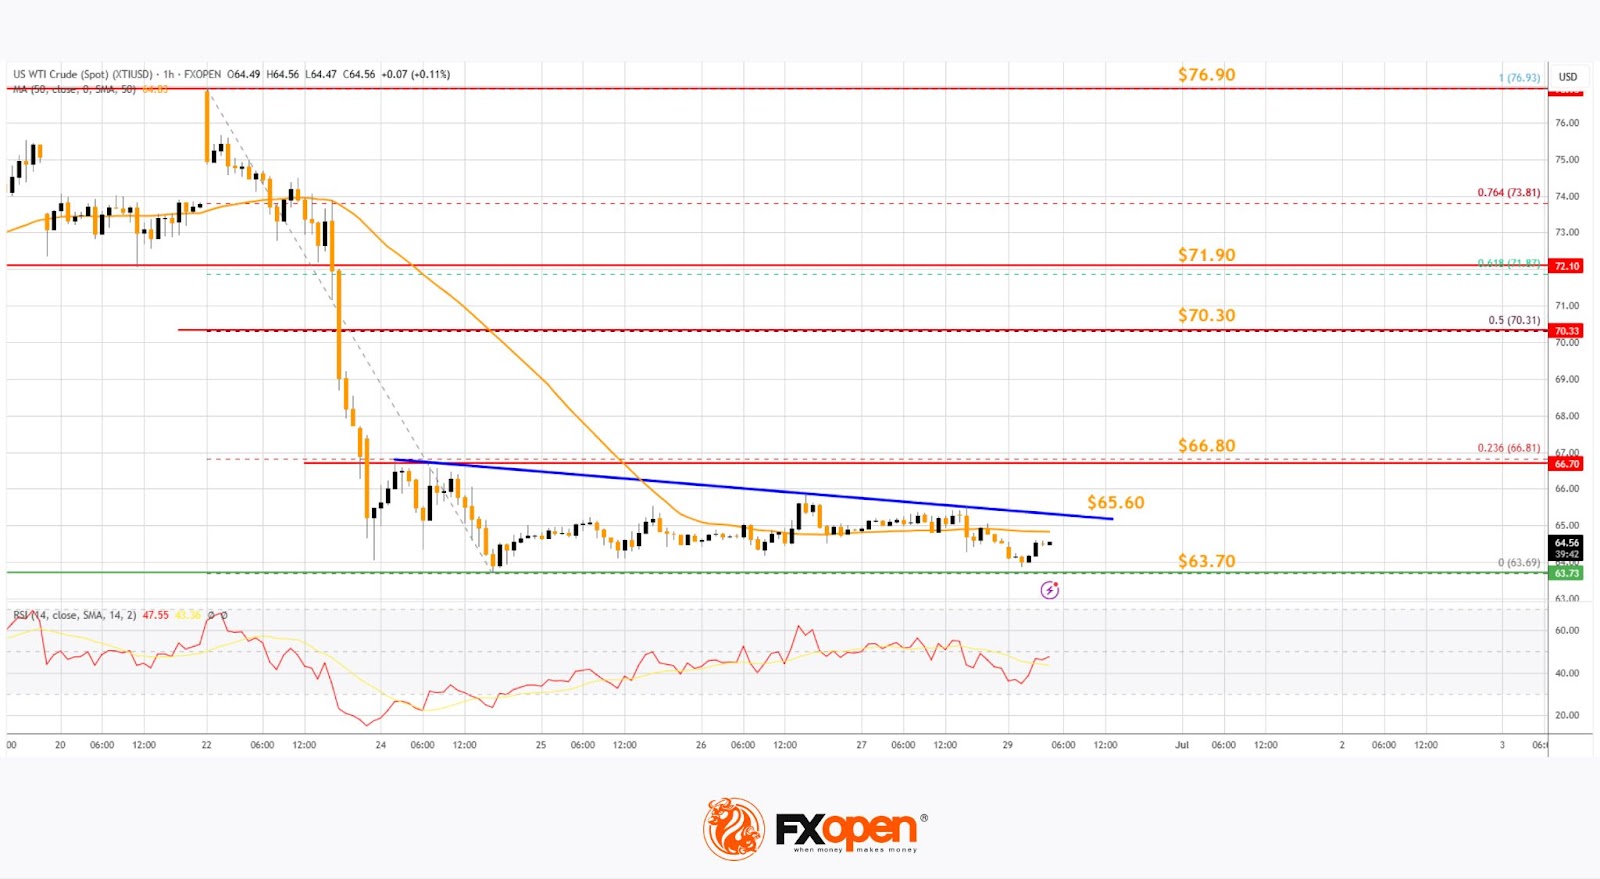
On the hourly chart of WTI Crude Oil at FXOpen, the price struggled to continue higher above $77.00 against the US Dollar. The price formed a short-term top and started a fresh decline below $72.00.
There was a steady decline below the $70.00 pivot level. The bears even pushed the price below $68.00 and the 50-hour simple moving average. Finally, the price tested the $63.70 zone. The recent swing low was formed near $63.69, and the price is now consolidating losses.
On the upside, immediate resistance is near the $65.60 zone. There is also a major bearish trend line forming with resistance near $65.60. The next resistance is near the $66.80 level or the 23.6% Fib retracement level of the downward move from the $76.93 swing high to the $63.69 low.
The main resistance is $70.30 and the 50% Fib retracement level. A clear move above the $70.30 zone could send the price toward $71.90.
The next key resistance is near $76.90. If the price climbs further higher, it could face resistance near $78.00. Any more gains might send the price toward the $80.00 level.
Immediate support is near the $63.70 level. The next major support on the WTI Crude Oil chart is near $62.00. If there is a downside break, the price might decline toward $60.00. Any more losses may perhaps open the doors for a move toward the $55.00 support zone.
Start trading commodity CFDs with tight spreads (additional fees may apply). Open your trading account now or learn more about trading commodity CFDs with FXOpen.
This article represents the opinion of the Companies operating under the FXOpen brand only. It is not to be construed as an offer, solicitation, or recommendation with respect to products and services provided by the Companies operating under the FXOpen brand, nor is it to be considered financial advice.
Stay ahead of the market!
Subscribe now to our mailing list and receive the latest market news and insights delivered directly to your inbox.


Latest articles

FTSE 100: Correction Has Ended, but a New Impulse Has Yet to Form
Fundamental backdrop
The UK inflation report for April, published on 20 May, delivered unexpectedly positive figures: annual inflation slowed to 2.8% in April 2026 from 3.3% in March, coming in below the consensus forecast of 3.0% and

Candlestick Wick Analysis in Trading
Candlestick wicks often contain critical information about buying and selling pressure that body patterns alone may not

Market Structure Shift (MSS) in Trading
A Market Structure Shift (MSS) is an ICT trading concept used to identify potential changes