


FXOpen

Gold price started a fresh surge above $4,800 and traded to a new all-time high. Crude oil is recovering and might rise toward $61.20.
Important Takeaways for Gold and WTI Crude Oil Prices Analysis Today
· Gold price rallied to a new all-time high and traded above $4,845 against the US Dollar.
· A key bullish trend line is forming with support at $4,775 on the hourly chart of gold at FXOpen.
· WTI Crude oil is recovering losses and trading above $59.00.
· There is a rising channel forming with support at $59.40 on the hourly chart of XTI/USD at FXOpen.
Gold Price Technical Analysis
On the hourly chart of Gold at FXOpen, the price formed support near $4,535. The price remained in a bullish zone and started a fresh increase above $4,600.
The bulls pushed the price above $4,800 and the 50-hour simple moving average. Finally, it traded to a new all-time high at $4,849. The price is still showing bullish signs above $4,800, and the RSI is above 80.
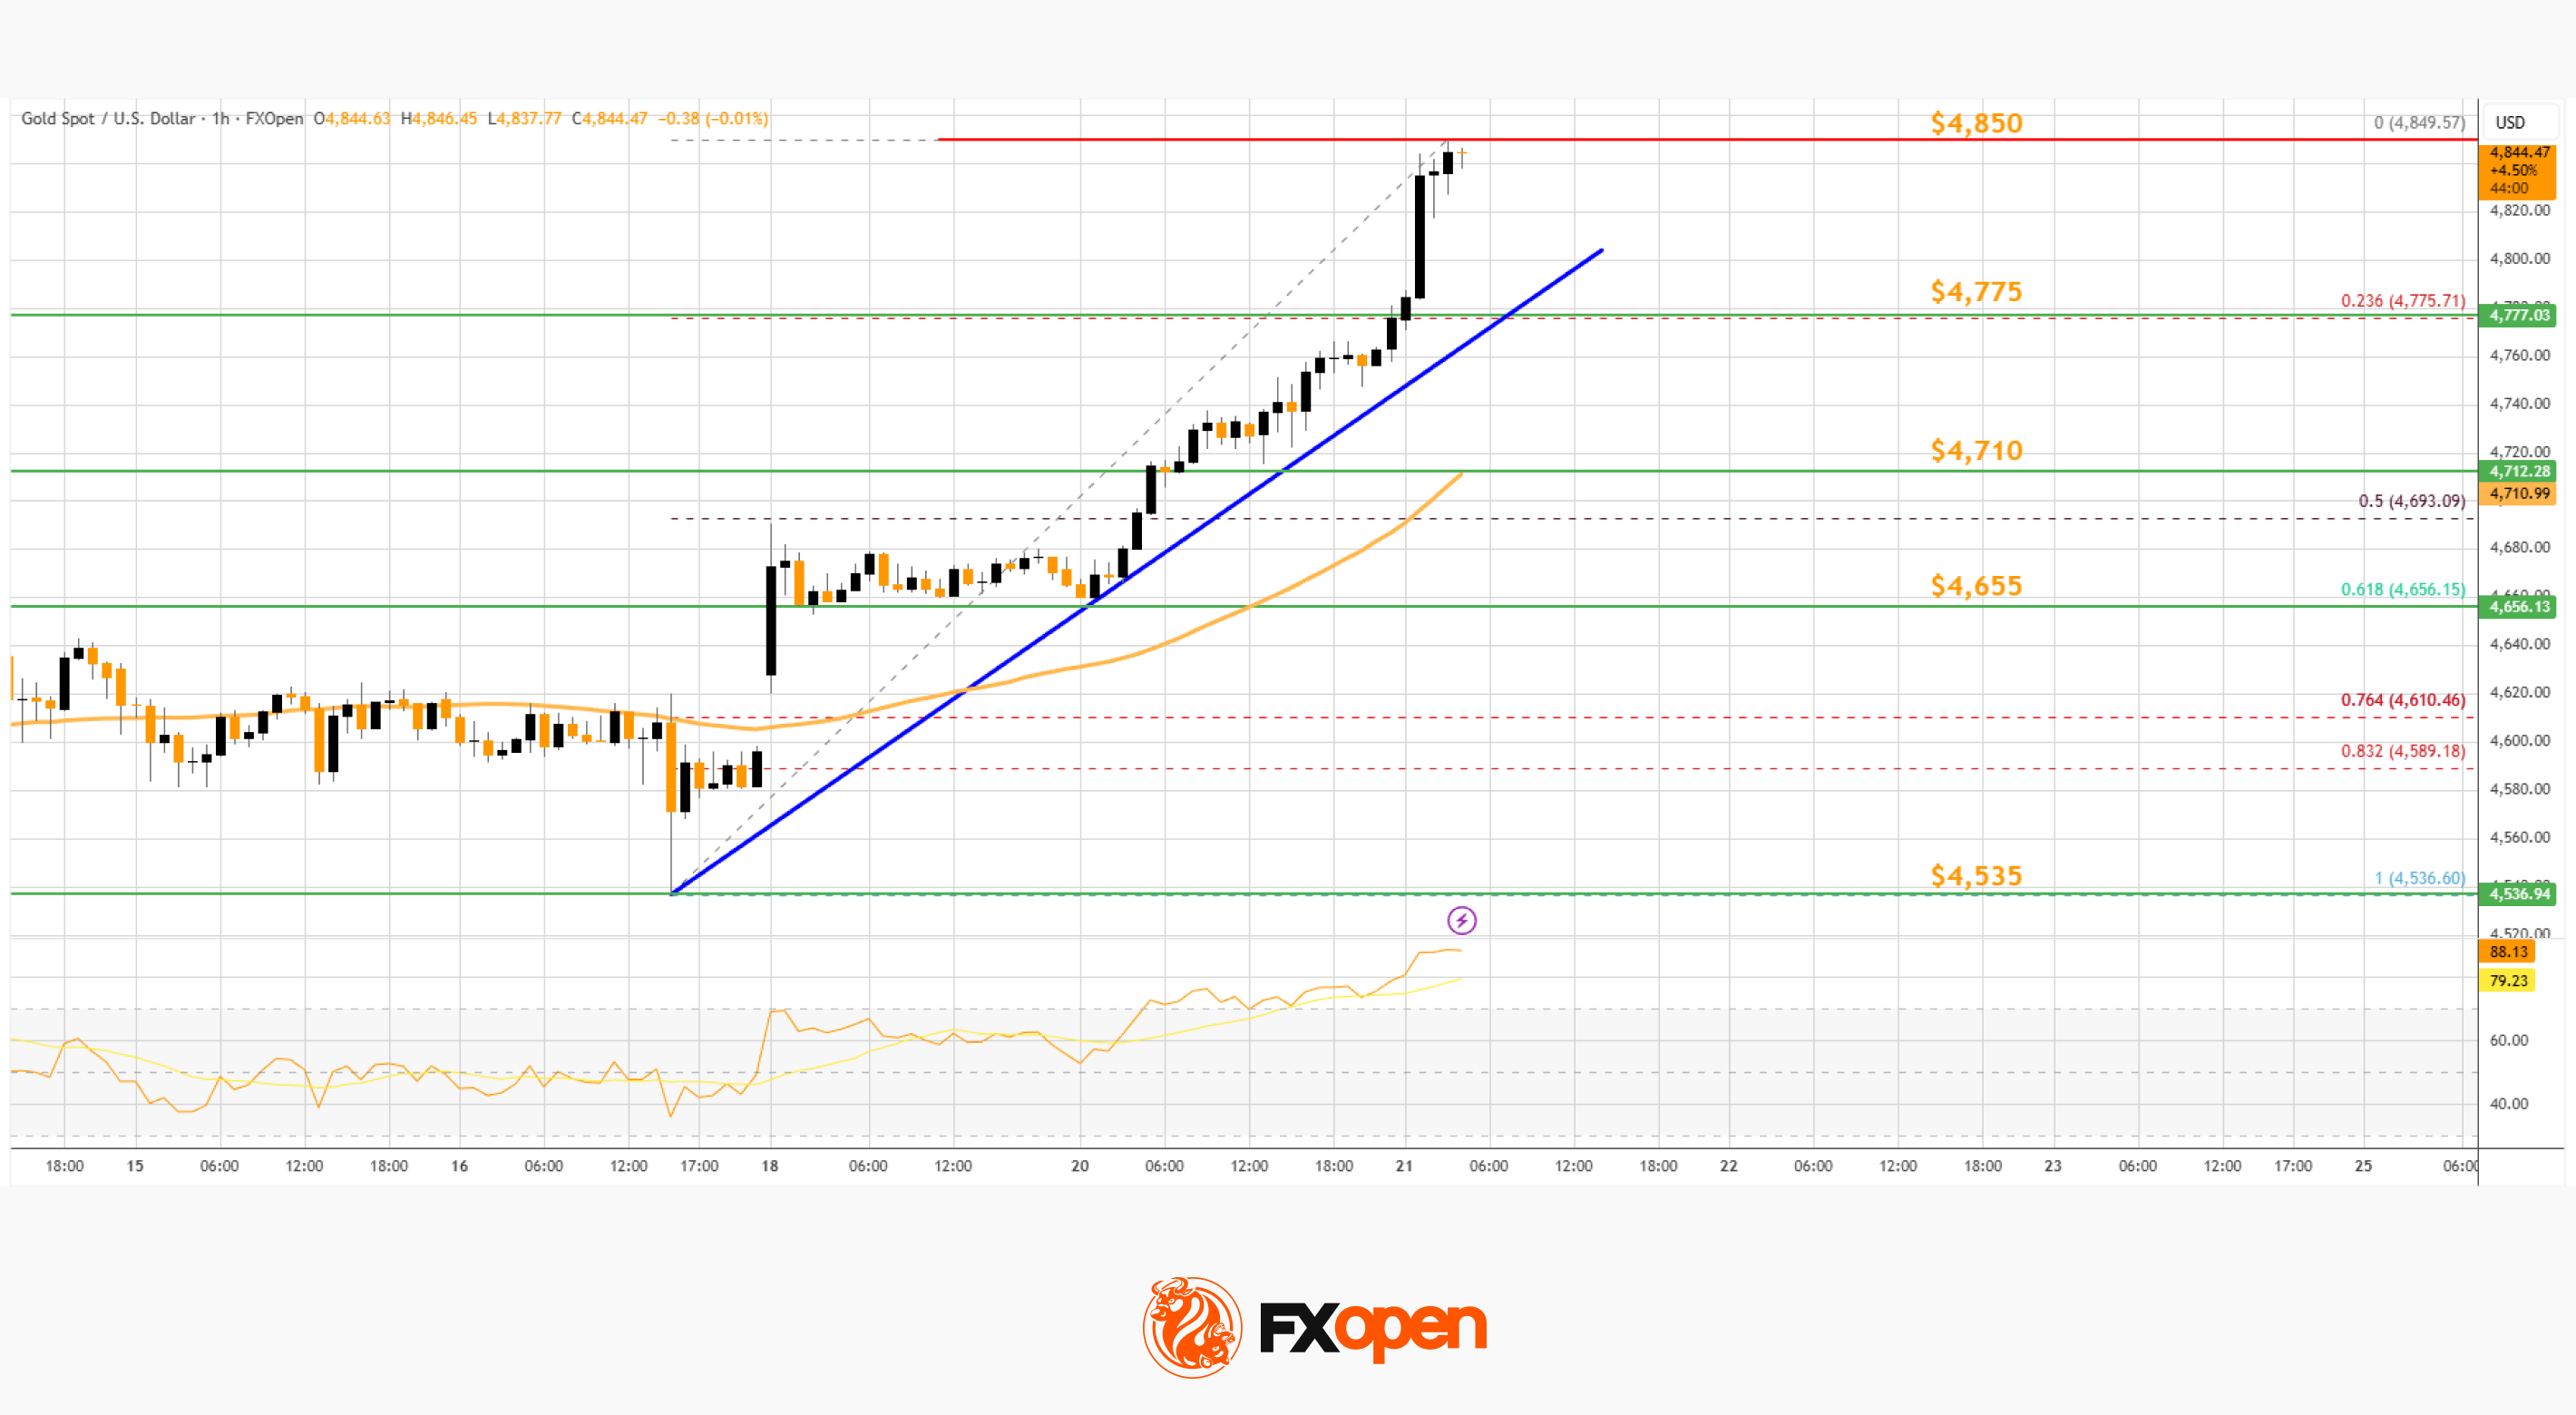
Initial bid zone on the downside could be near the 23.6% Fib retracement level of the upward move from the $4,536 swing low to the $4,849 high at $4,775. There is also a key bullish trend line forming with support at $4,775.
The next area of interest might be near the 50-hour simple moving average at $4,710. A downside break below $4,710 might send the price to $4,655 and the 61.8% Fib retracement.
If the bulls fail to protect $4,655, the price could start a larger downside correction. In the stated case, Gold could drop toward $4,535. The next area for the bulls might be $4,500. A daily close below $4,500 could spark bearish moves and send the price to $4,350.
If there is a fresh increase, the price could face resistance at $4,845. The next sell zone might be $4,880. An upside break above the $4,880 resistance could send Gold price toward $4,950. Any more gains may perhaps set the pace for an increase to $5,000.
WTI Crude Oil Price Technical Analysis
On the hourly chart of WTI Crude Oil at FXOpen, the price found support near $58.50 against the US Dollar. The price formed a base and started a recovery wave above $59.00 and the 50-hour simple moving average.
The bulls were able to push the price to the 50% Fib retracement level of the downward move from the $62.17 swing high to the $58.53 swing low. Besides, there is a rising channel forming with support at $59.40.
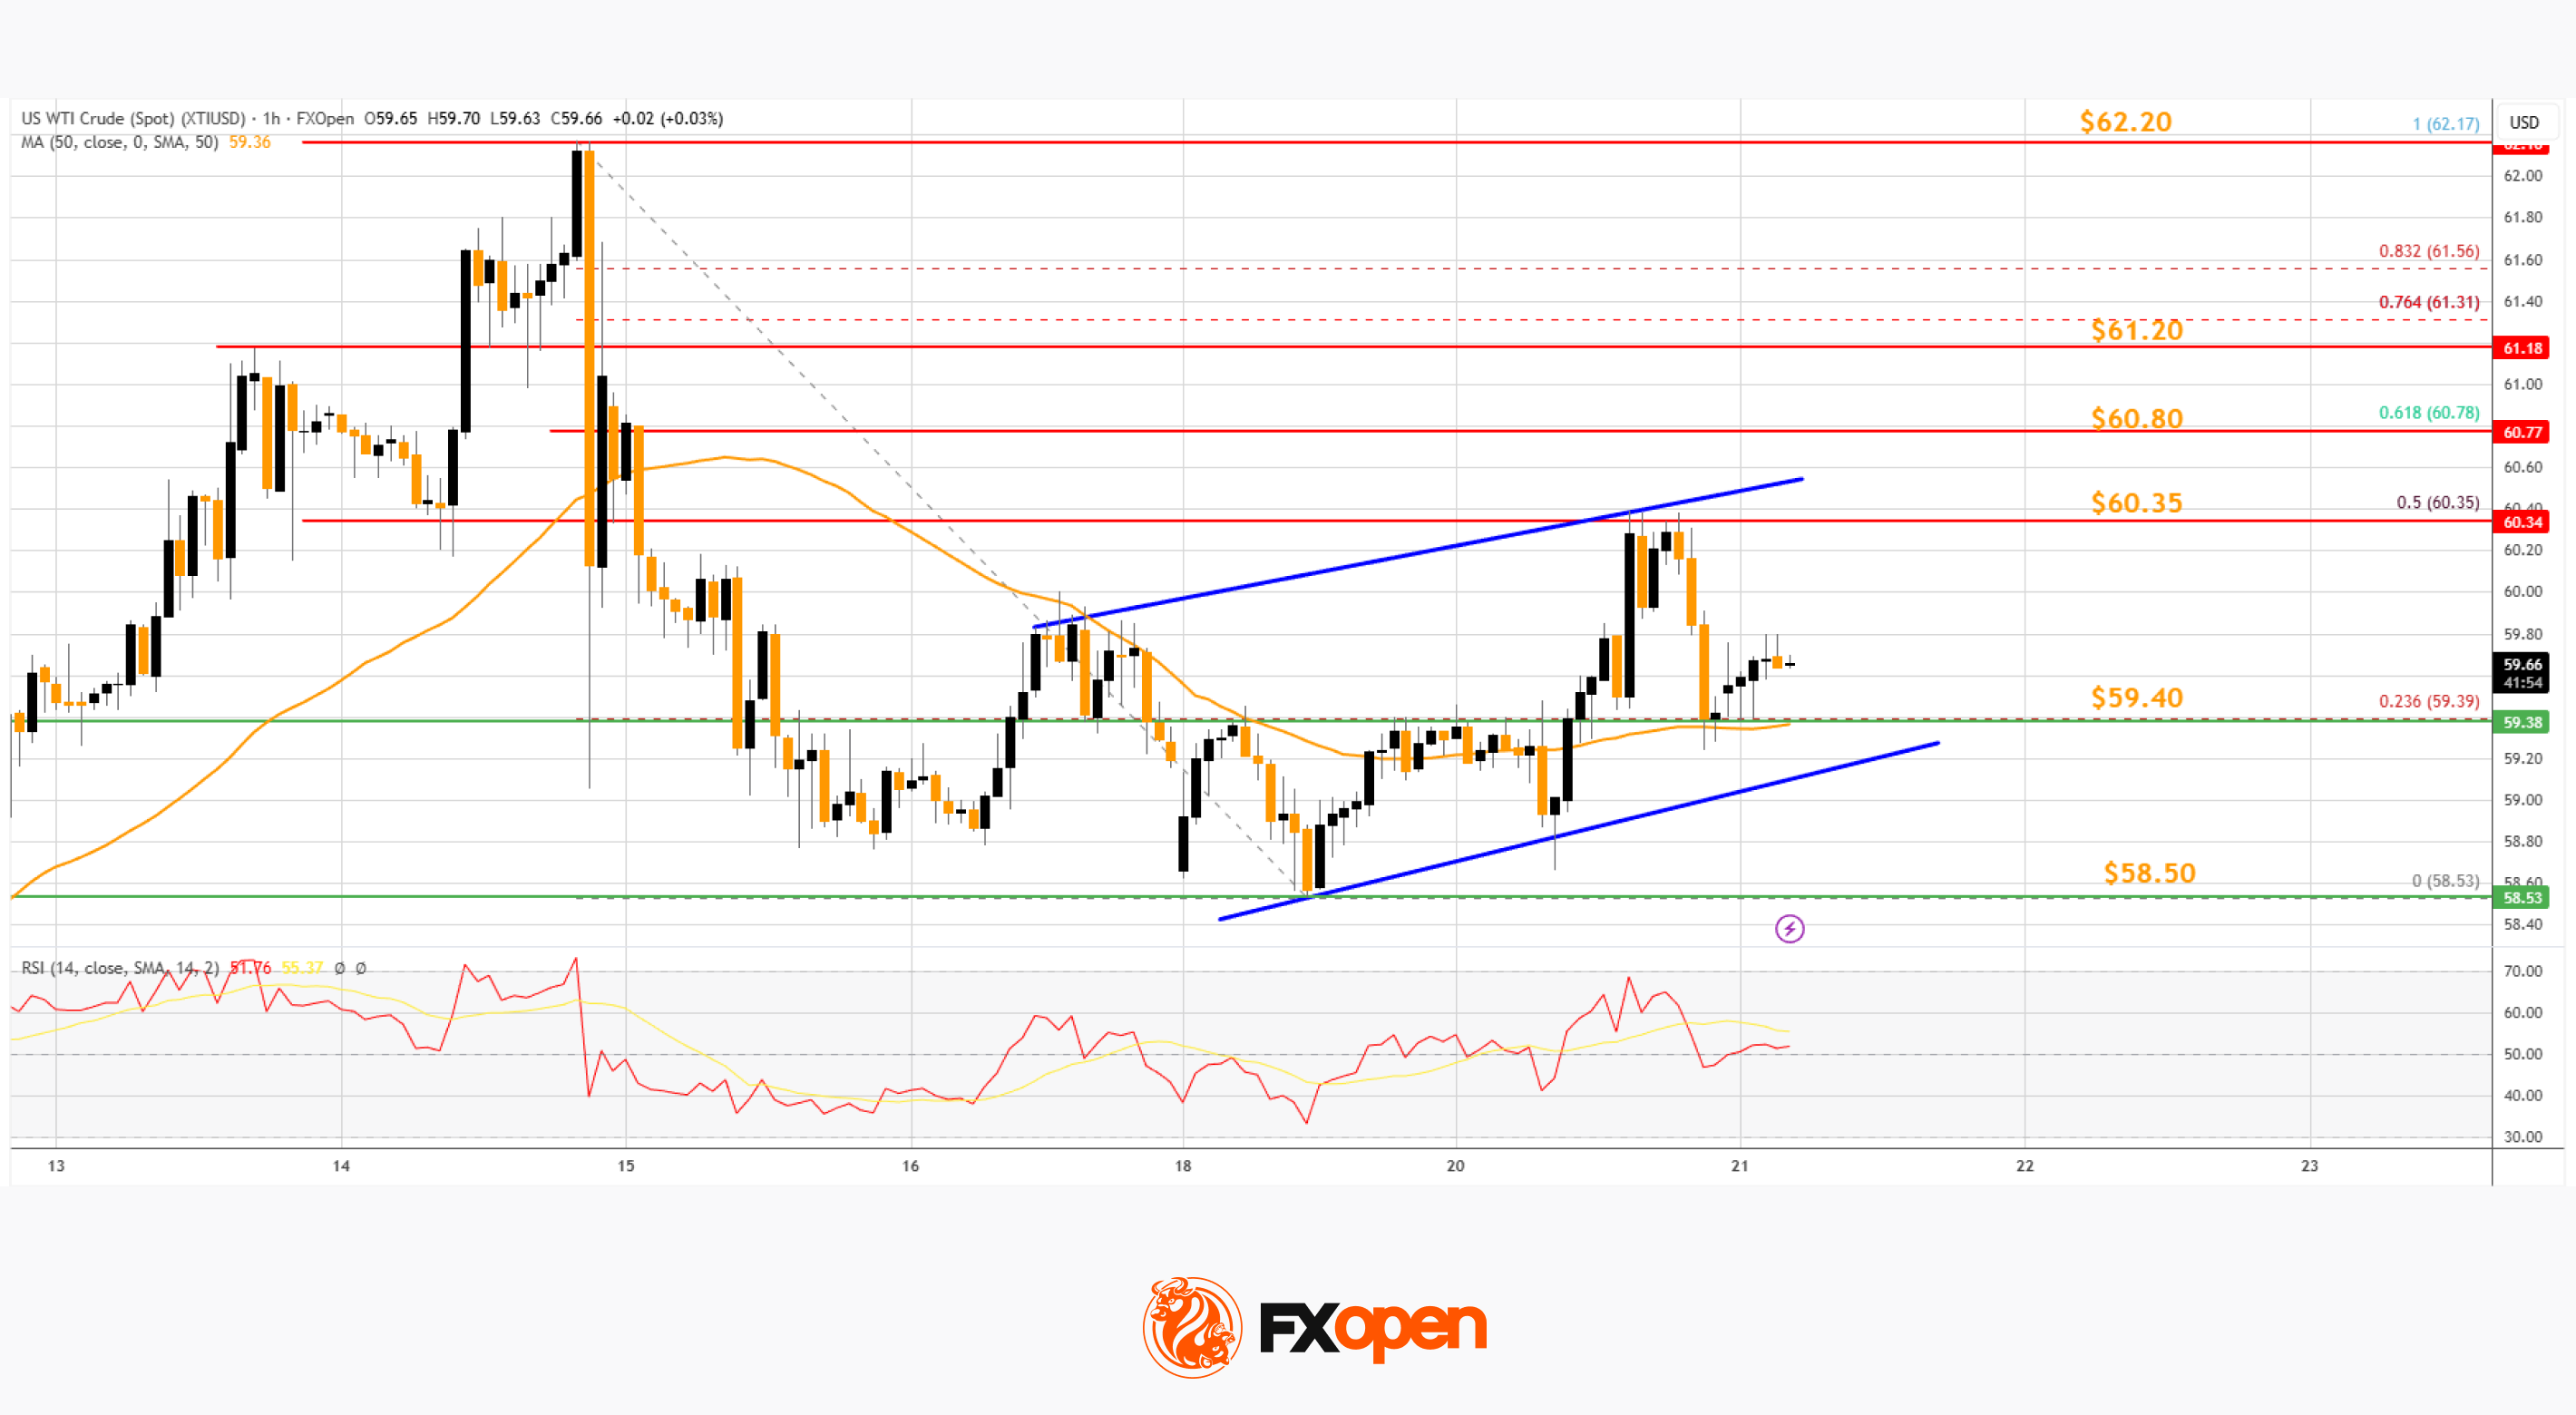
The hourly RSI is above the 80 level, and the price is currently consolidating below the $60.30 barrier. The next hurdle could be $60.80 and the 61.8% Fib retracement.
A clear move above $60.80 could send the price toward $61.20. Any more gains might open the doors for a test of $62.200. Conversely, the price might start a fresh decline from $60.35 or $60.80. Immediate support sits near $59.40 or the 50-hour simple moving average.
The key breakdown zone on the WTI crude oil chart might be $58.50. If there is a downside break, the price might decline toward $58.00. Any more losses might encourage the bears for a push toward $56.50.
Start trading commodity CFDs with tight spreads (additional fees may apply). Open your trading account now or learn more about trading commodity CFDs with FXOpen.
This article represents the opinion of the Companies operating under the FXOpen brand only. It is not to be construed as an offer, solicitation, or recommendation with respect to products and services provided by the Companies operating under the FXOpen brand, nor is it to be considered financial advice.
Stay ahead of the market!
Subscribe now to our mailing list and receive the latest market news and insights delivered directly to your inbox.


Latest articles

USD/CAD Rises to a Two-Month High
Today, the USD/CAD currency pair climbed above the 1.3787 level for the first time since late January.
→ Demand for the US dollar is being supported by concerns over escalating tensions in the Middle East. Market participants are favouring

Alphabet (GOOGL) Shares Fall to 2026 Low
As the chart shows, Alphabet (GOOGL) shares have dropped to their lowest level of 2026, with trading closing well below the psychological $300 per share mark.
Why Have Alphabet (GOOGL) Shares Declined?
The bearish move is driven by a combination

FX Market Awaits Macro Data: EUR/USD and GBP/USD Near Range Boundaries
European currencies are trading without a clear direction against the US dollar, remaining in a consolidation phase following the earlier decline driven by USD strength. At the start of the week, both EUR/USD and GBP/USD attempted a recovery,