


Market Analysis: Gold Hit Hard While WTI Crude Oil Rallies on Intensifying Iran Crisis
FXOpen
Gold price extended losses below $4,500 before the bulls appeared. WTI Crude oil prices are rising and could climb further higher toward $105.00.
Important Takeaways for Gold and WTI Crude Oil Prices Analysis Today
· Gold price failed to clear $5,000 and declined heavily against the US Dollar.
· There is a key bearish trend line forming with resistance at $4,525 on the hourly chart of gold at FXOpen.
· WTI Crude oil prices are moving higher above the $95.00 resistance zone.
· There was a break above a connecting bearish trend line at $97.00 on the hourly chart of XTI/USD at FXOpen.
Gold Price Technical Analysis
On the hourly chart of Gold at FXOpen, the price failed to settle above $5,000 and reacted to the downside, as discussed in the previous analysis. The price traded below $4,800 and $4,650 to enter a bearish zone.
There was a sharp drop below $4,500. The price settled below the 50-hour simple moving average, and RSI dipped below 30. Finally, it tested the $4,320 zone. A low was formed at $4,319, and the price is now consolidating losses.
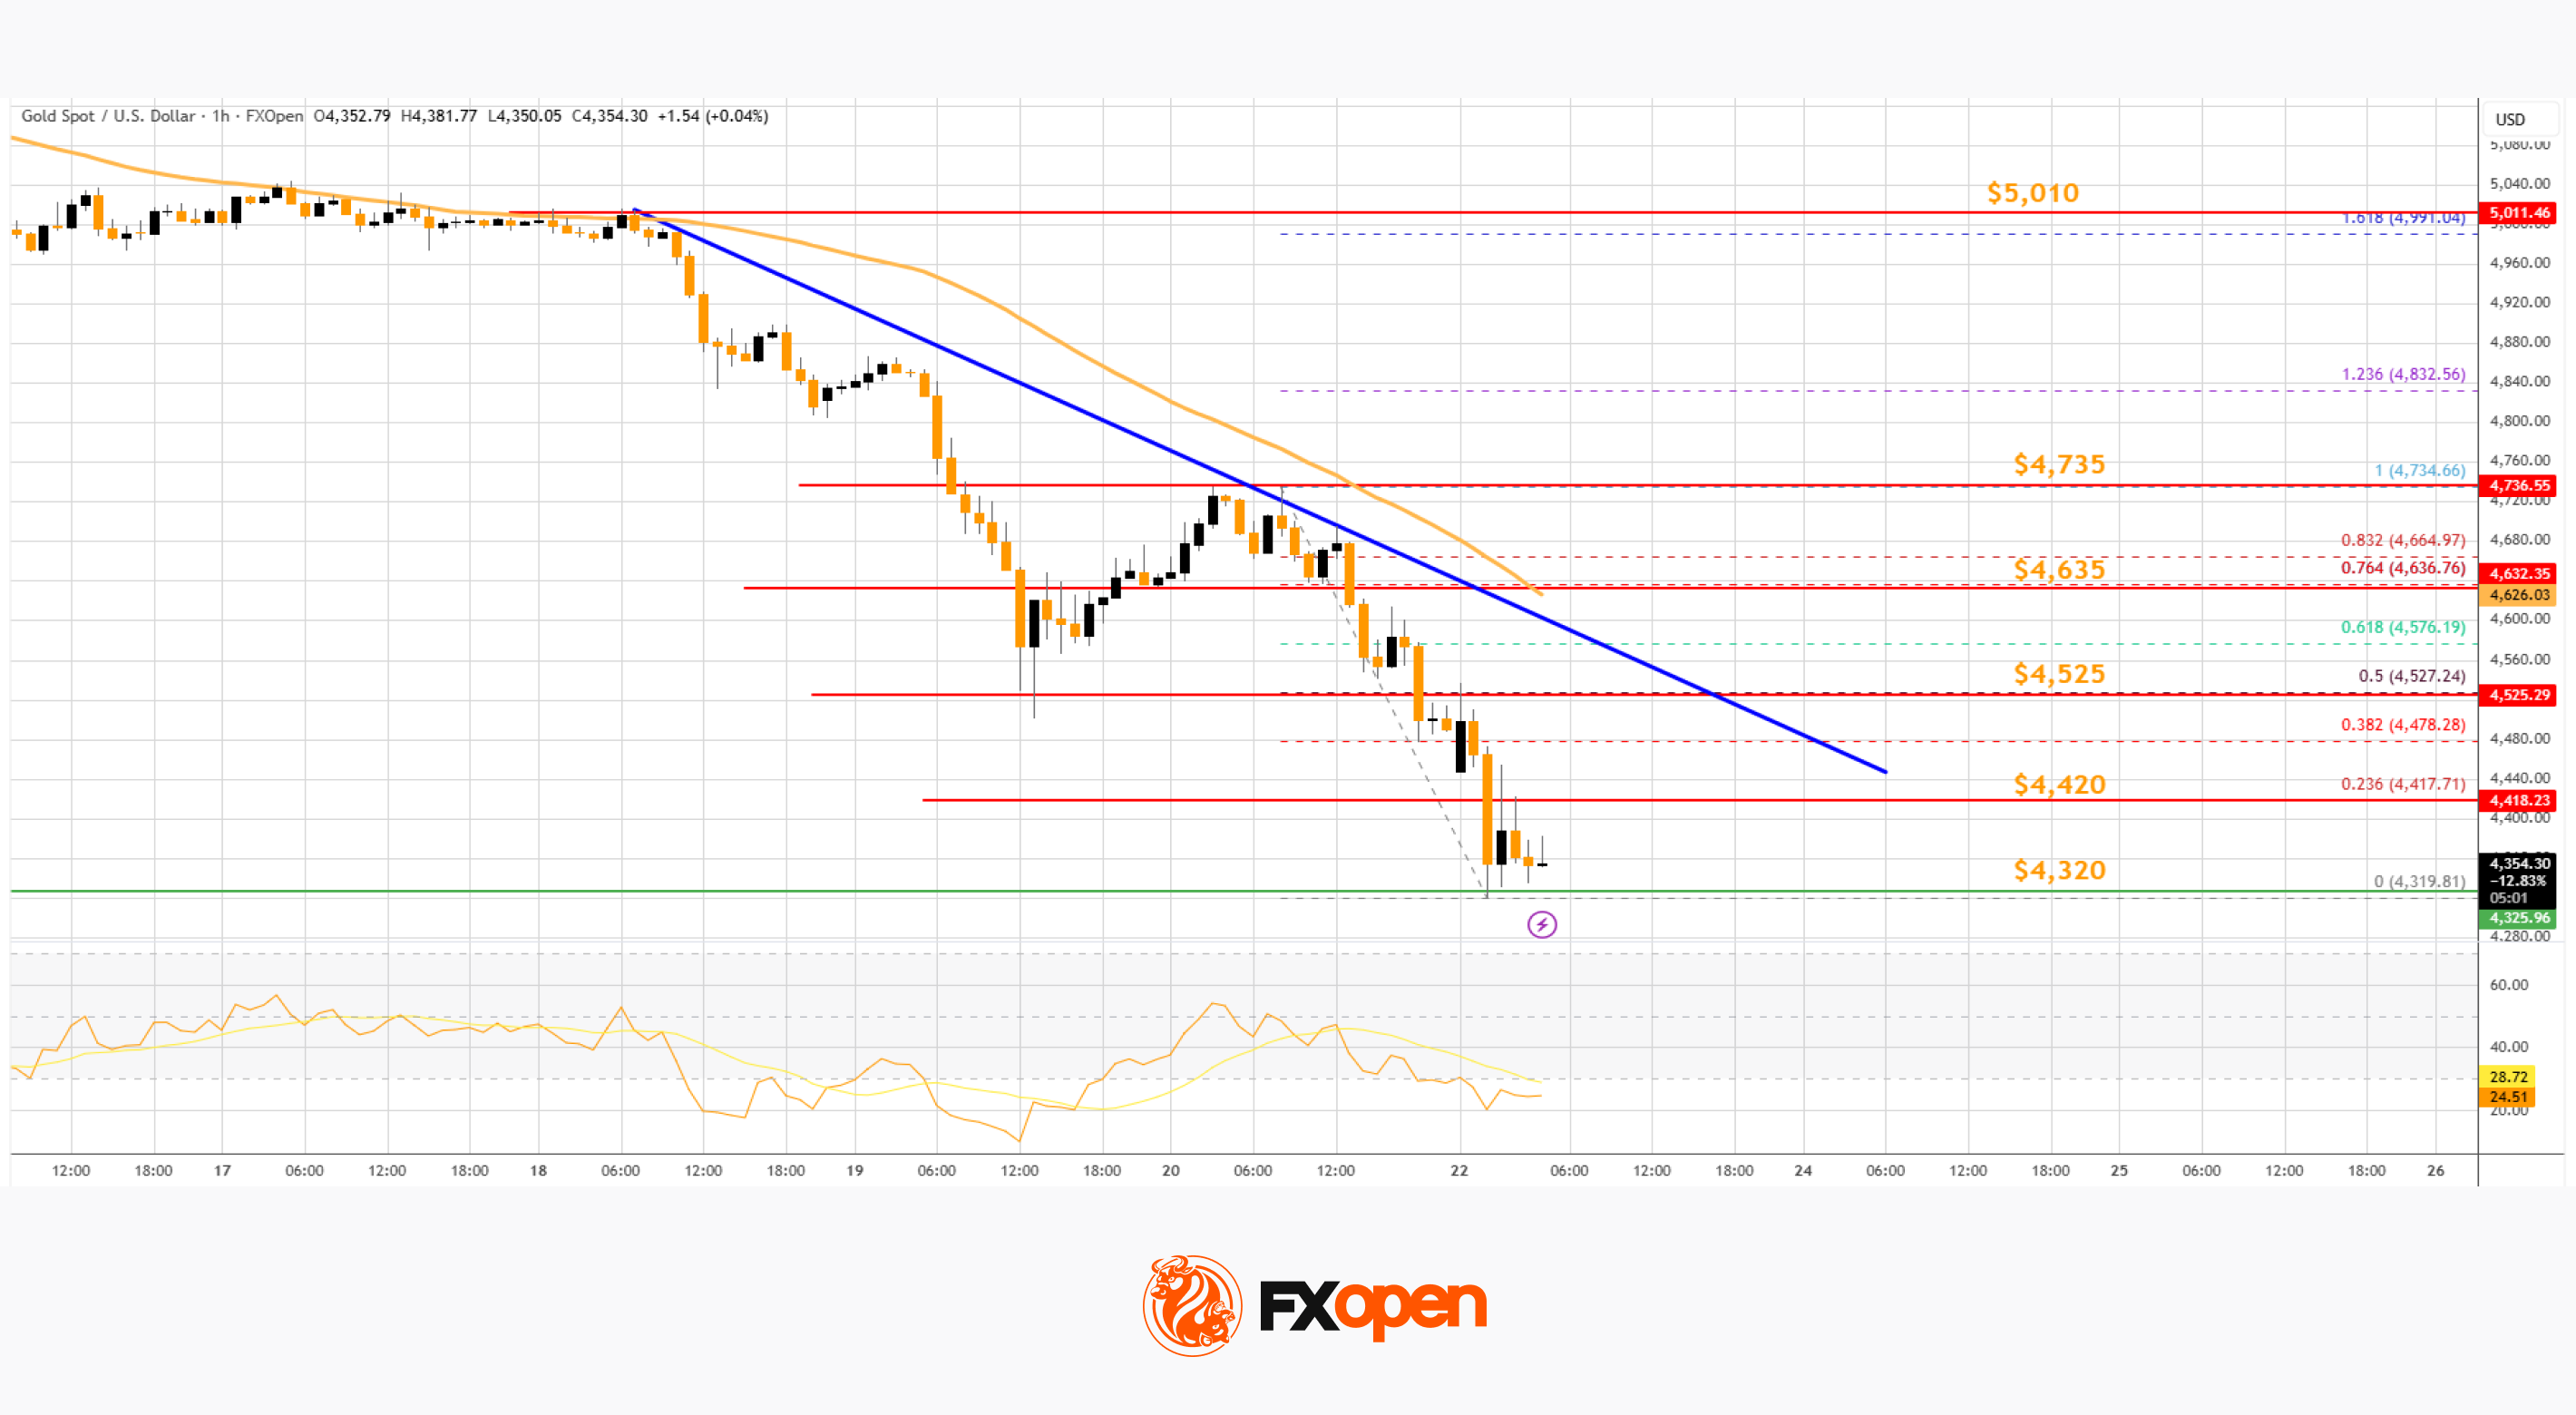
Immediate resistance on the upside is $4,420 or the 23.6% Fib retracement level of the downward move from the $4,734 swing high to the $4,319 low.
The first major hurdle sits at $4,525. There is also a key bearish trend line forming with resistance at $4,525 and the 50% Fib retracement. A close above $4,525 could initiate a recovery wave to $4,635. An upside break above $4,635 could send Gold price toward $4,735. Any more gains may perhaps set the pace for an increase toward $5,010.
If there is no fresh increase, the price could continue to move down. Initial support on the downside is near the $4,320 level. The first key area of interest might be $4,300. If there is a downside break below $4,300, the price might decline further. In the stated case, the price might drop to $4,200.
WTI Crude Oil Price Technical Analysis
On the hourly chart of WTI Crude Oil at FXOpen, the price started a strong increase from $91.80 against the US Dollar. The price gained bullish momentum after it broke $95.00.
There was a sustained upward movement above $95.50 and $98.00. More importantly, there was a break above a connecting bearish trend line at $97.00. The bulls pushed the price above the 50-hour simple moving average, and the RSI climbed toward 60.
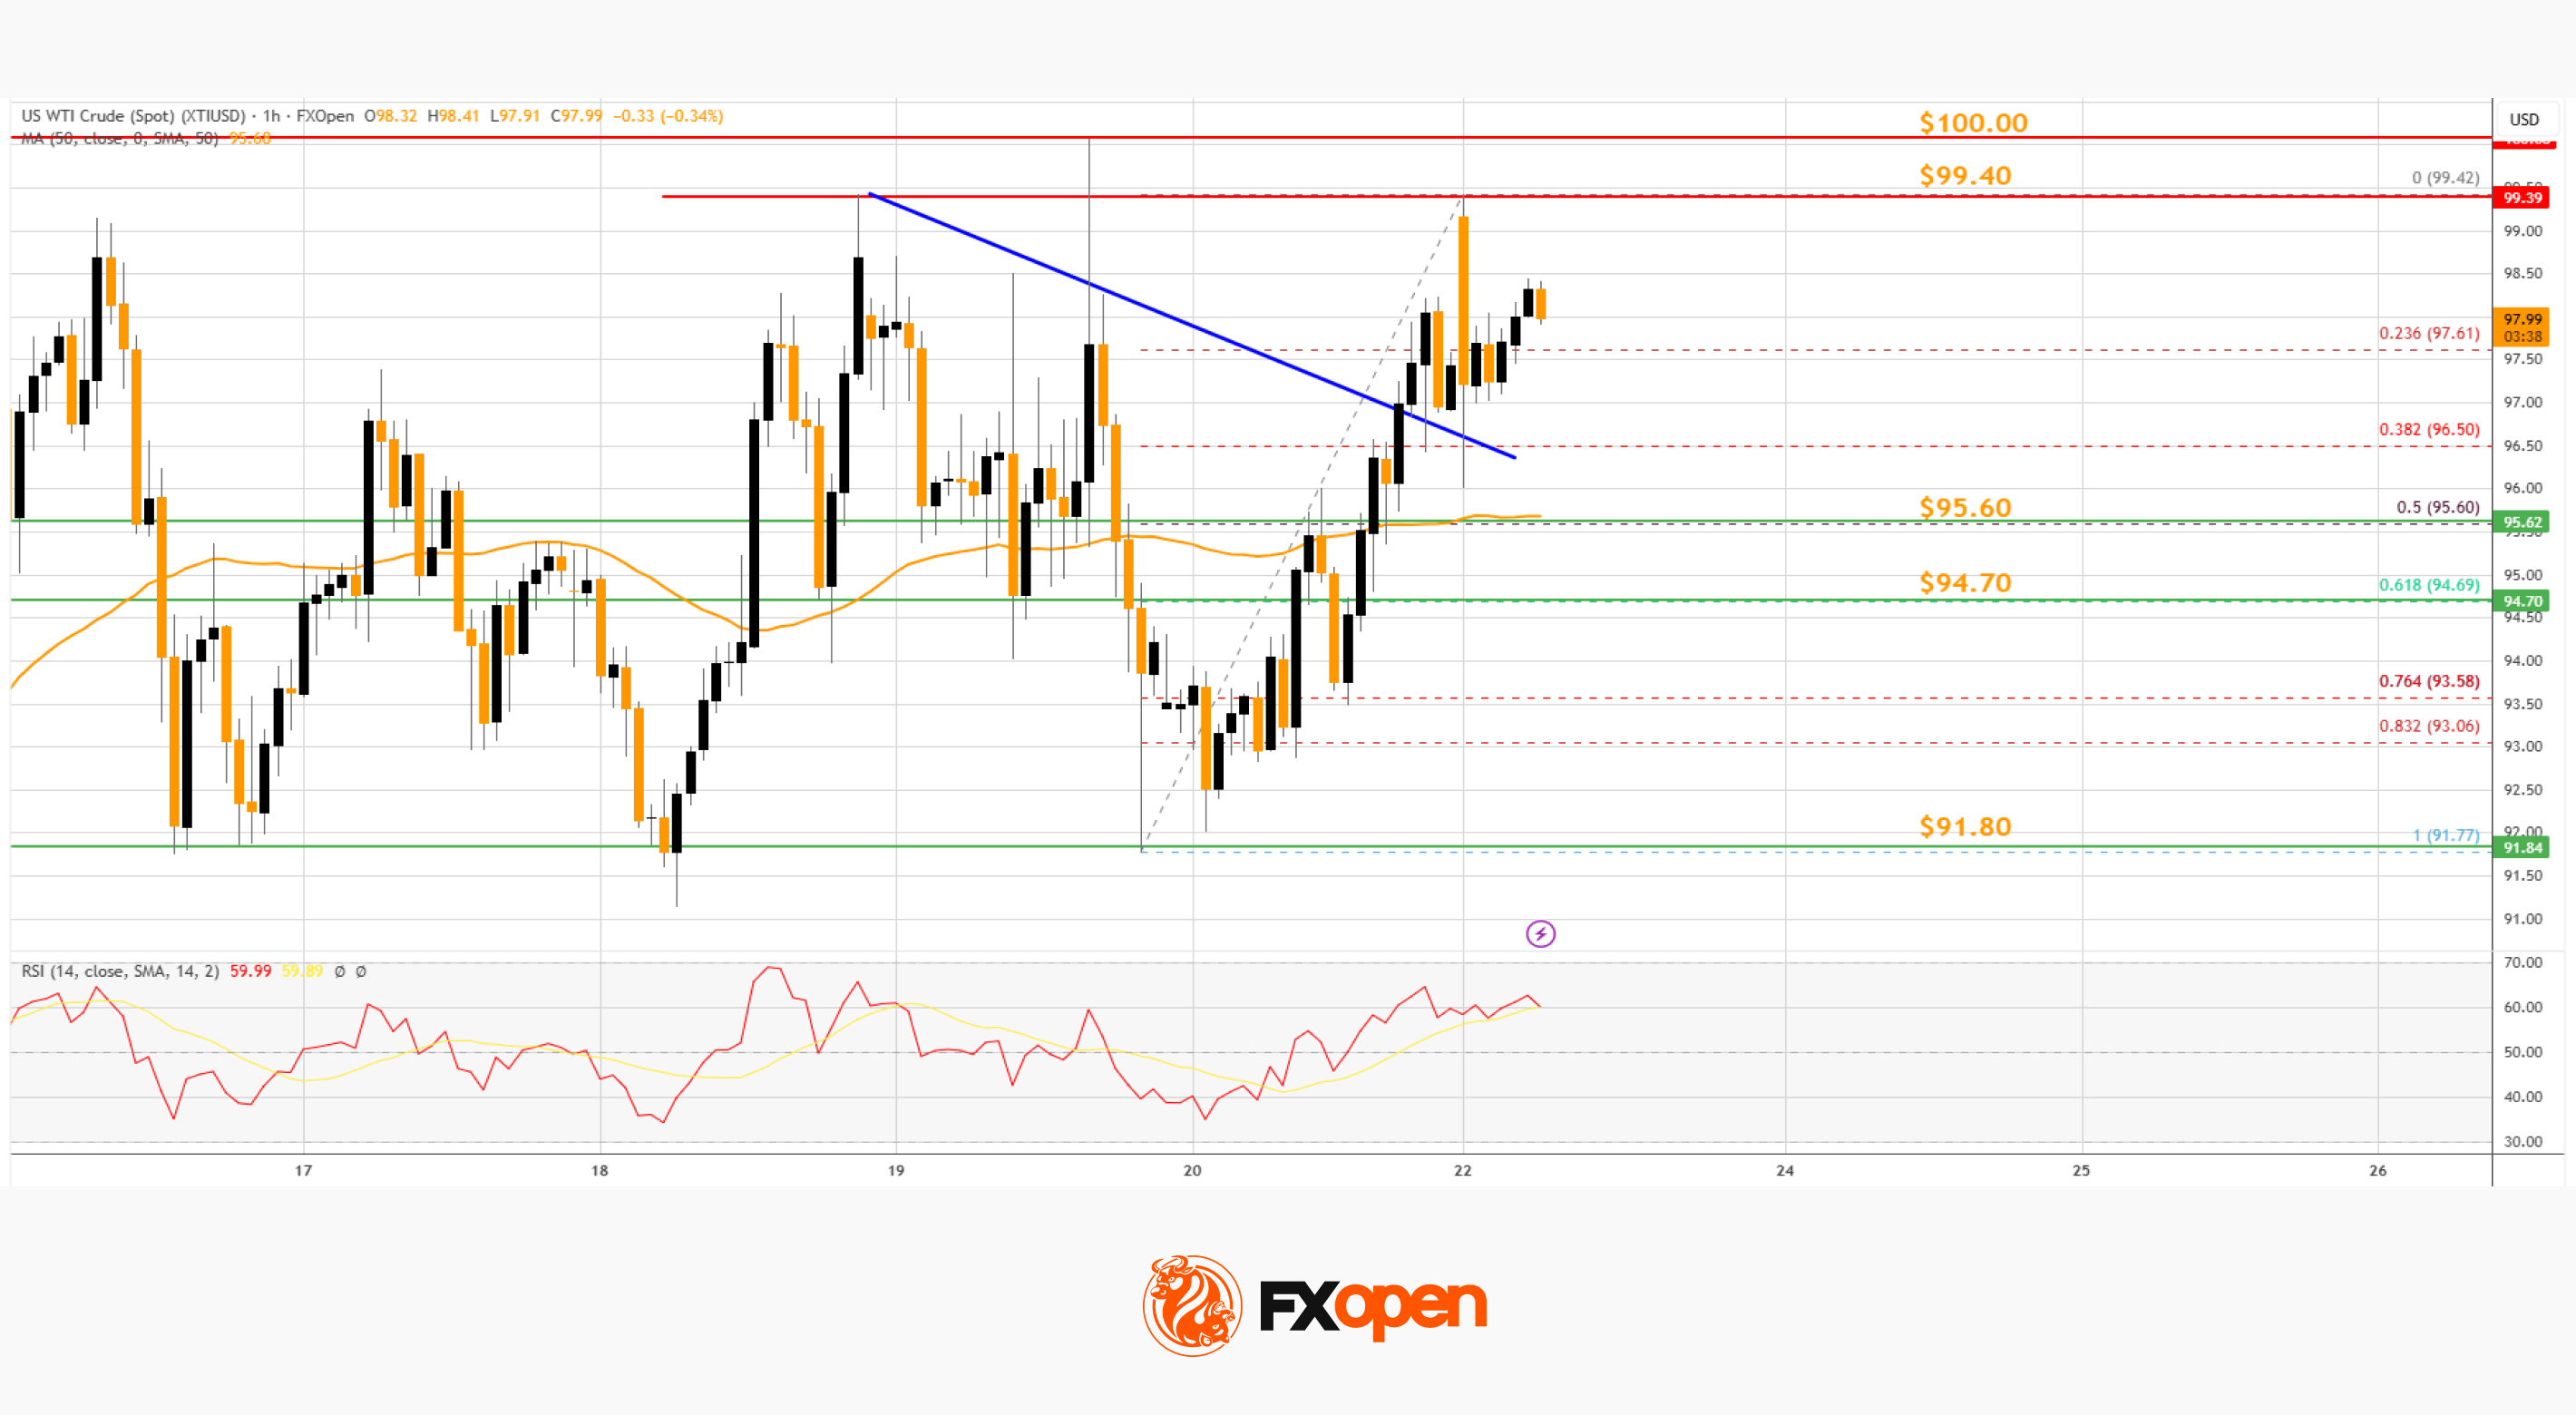
A high was formed near $99.42 before there was a minor pullback. The price declined below the 23.6% Fib retracement level of the upward move from the $91.77 swing low to the $99.42 high.
However, the bulls are active above $95.00. Immediate resistance is $99.40. If the price climbs further, it could face hurdles near $100.00. The next major stop for the bulls might be $102.00. Any more gain might send the price toward $105.00.
Conversely, the price might correct gains and retest the 50-hour simple moving average at $95.60 and the 50% Fib retracement. The next area of interest on the WTI crude oil chart could be $94.70.
If there is a downside break, the price might decline to $91.80. Any more losses may perhaps open the doors for a move toward $85.00.
Start trading commodity CFDs with tight spreads (additional fees may apply). Open your trading account now or learn more about trading commodity CFDs with FXOpen.
This article represents the opinion of the Companies operating under the FXOpen brand only. It is not to be construed as an offer, solicitation, or recommendation with respect to products and services provided by the Companies operating under the FXOpen brand, nor is it to be considered financial advice.
Stay ahead of the market!
Subscribe now to our mailing list and receive the latest market news and insights delivered directly to your inbox.


Latest articles

Market Analysis: GBP/USD Holds Firm, USD/CAD Bulls Target Breakout Move
GBP/USD started a downside correction from 1.3480. USD/CAD is gaining bullish momentum and might clear 1.3880 for more upside.
Important Takeaways for GBP/USD and USD/CAD Analysis Today
· The British Pound rallied toward 1.3500


Market Repricing of Risk as Gold Loses Safe-Haven Demand
Geopolitical tensions in the Middle East had remained the primary macro driver for the gold market over recent weeks; however, on 8 April the situation shifted sharply as the United States and Iran agreed to a temporary two-week ceasefire, including