


Market Repricing of Risk as Gold Loses Safe-Haven Demand
FXOpen

Geopolitical tensions in the Middle East had remained the primary macro driver for the gold market over recent weeks; however, on 8 April the situation shifted sharply as the United States and Iran agreed to a temporary two-week ceasefire, including the reopening of the Strait of Hormuz and a pause in military strikes. The easing of acute tensions triggered a sharp decline in oil prices and a return of risk appetite across global markets, weighing on demand for safe-haven assets. As a result, gold retreated from intraday highs near 4,850.
That said, the durability of the agreement remains uncertain. Reports of localised strikes in the region continue to keep market participants on edge, preventing a full dismissal of Iranian-related risks. Additional influence comes from macroeconomic data—particularly US inflation—whose interpretation in the context of Federal Reserve rate expectations continues to shape dollar dynamics. Structural support from central banks persists, with China continuing to increase its gold reserves, while Malaysia and South Korea have resumed purchases after an extended pause.
Technical Outlook
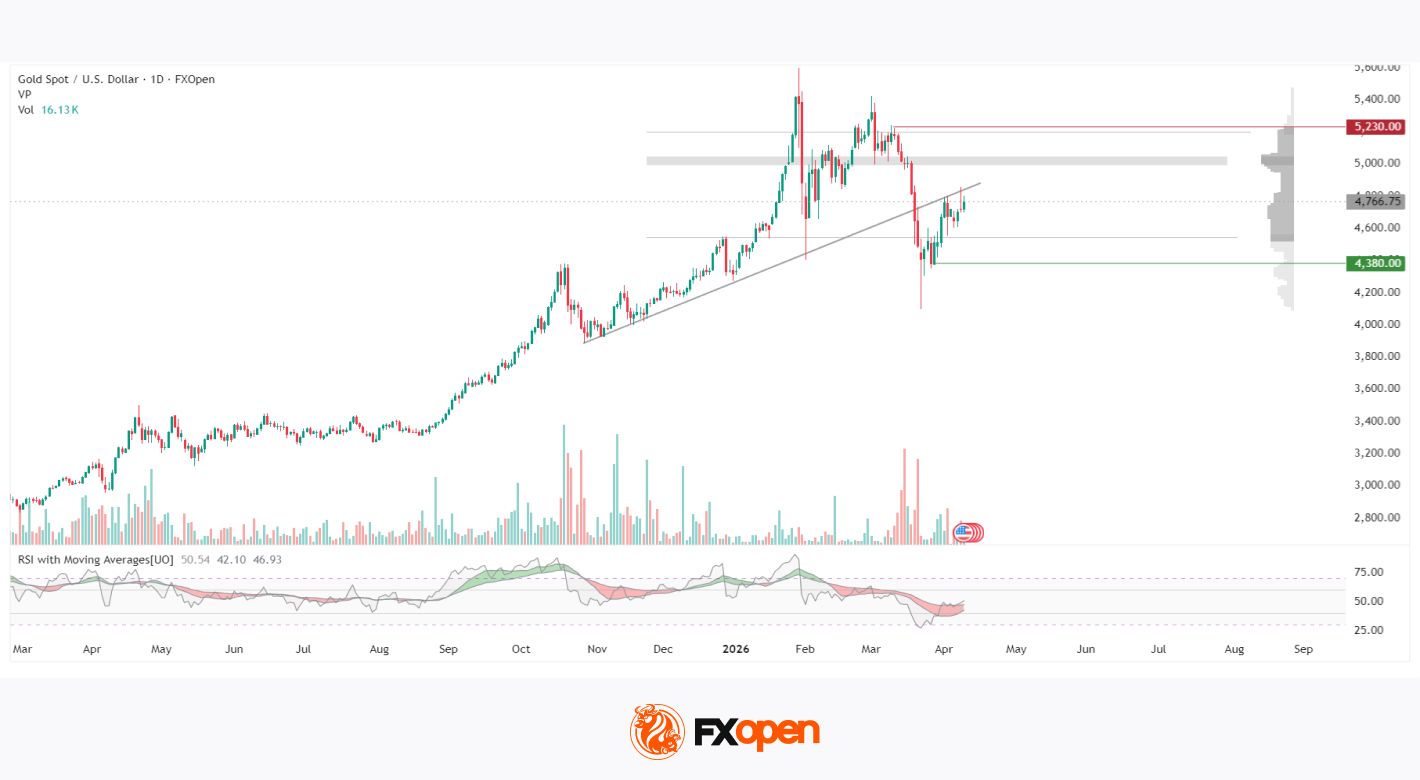
On the daily chart of XAU/USD, a clear two-phase structure appears to be forming. An uptrend that began in March 2024 drove prices to a record high in the 5,595–5,600 range by late January 2026, followed by a sharp and impulsive decline. Notably, the peak in vertical volume occurred not at the price high, but during the subsequent sell-off in March 2026, which may indicate a climactic phase of selling rather than buying.
The low of that move was recorded near 4,100, from which price has rebounded to current levels around 4,766. The horizontal volume profile reveals a dense cluster in the 4,990–5,050 zone, marking the point of control (POC), where trading activity appears to have been most concentrated. This area may act as a natural resistance zone for further upside. The next significant level above is seen at 5,230.
The ascending trend line originating from autumn 2025 was broken to the downside in March 2026 and no longer appears to serve as support for buyers. It may now act as an additional resistance near the 5,000 level.
The lower boundary of the current range is located around 4,380. The RSI and moving averages stand at 50.54 / 42.10 / 46.93, with the RSI hovering near the neutral 50 level and remaining below both upward-sloping moving averages, suggesting a lack of confirmed directional momentum.
Summary
Following the completion of an active corrective phase, gold appears to have stabilised below the POC zone, while the RSI remains near neutral levels without a clear directional bias. The current trading range—4,380 on the downside and 5,230 on the upside—continues to define the market structure, as geopolitical developments and Federal Reserve rhetoric may continue to shape short-term price dynamics.
Start trading commodity CFDs with tight spreads (additional fees may apply). Open your trading account now or learn more about trading commodity CFDs with FXOpen.
This article represents the opinion of the Companies operating under the FXOpen brand only. It is not to be construed as an offer, solicitation, or recommendation with respect to products and services provided by the Companies operating under the FXOpen brand, nor is it to be considered financial advice.
Stay ahead of the market!
Subscribe now to our mailing list and receive the latest market news and insights delivered directly to your inbox.


Latest articles

CAD/JPY: The Yen's Most Historic Move in 30 Years Meets a Fragile Support
Two central banks are heading in genuinely opposite directions this week, and the tension is unmistakable. The Bank of Canada held rates steady at 2.25% on September 2, with a mildly hawkish tilt as policymakers acknowledged a broadening economic

USD/JPY and USD/CAD Await Key Fed Decision
The US dollar is consolidating against the yen and Canadian dollar ahead of the key event of the week — the Federal Reserve meeting. The Fed is widely expected to raise its policy rate by 25 basis points to a range

UnitedHealth: Fundamentals Are Healing, Now the Chart Must Agree
UnitedHealth finds itself in a genuinely split narrative right now, trading near $388, down about 15.9% from its 52-week high, even as the fundamental picture keeps improving. Q2 earnings beat expectations, with revenue of $112.03 billion, and the