


Market Analysis: Gold Price and Crude Oil Price Correct Recent Gains
FXOpen

Gold price started a downside correction from $2,485. Crude oil prices are also moving lower from the $82.20 resistance zone.
Important Takeaways for Gold and Oil Prices Analysis Today
- Gold price climbed higher toward the $2,485 zone before there was a pullback against the US Dollar.
- A key bearish trend line is forming with resistance near $2,450 on the hourly chart of gold at FXOpen.
- Crude oil prices extended downsides below the $81.30 support zone.
- A major contracting triangle is forming with resistance near $80.70 on the hourly chart of XTI/USD at FXOpen.
Gold Price Technical Analysis
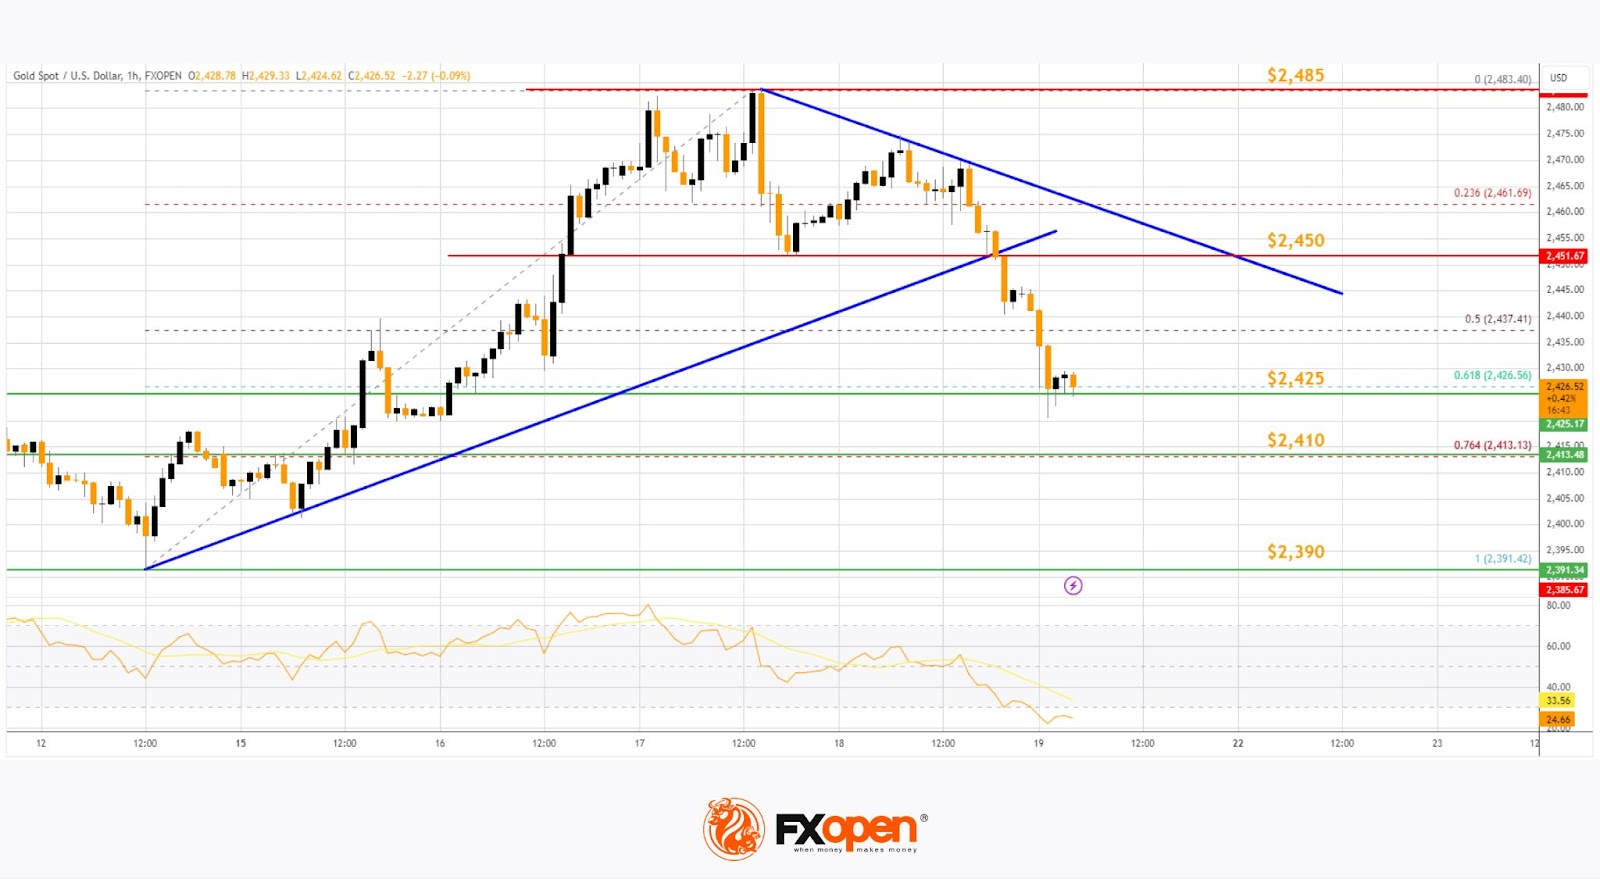
On the hourly chart of Gold at FXOpen, the price rallied heavily above the $2,425 resistance. The price even spiked above $2,480 before the bears appeared.
A high was formed near $2,483 before there was a downside correction. There was a move below the $2,465 support level. The bears even pushed the price below the $2,450 support and the 50-hour simple moving average.
The price declined below the 50% Fib retracement level of the upward move from the $2,391 swing low to the $2,483 high. If the bears remain in action, the price might decline further.
Initial support on the downside is near the $2,425 level. It is near the 61.8% Fib retracement level of the upward move from the $2,391 swing low to the $2,483 high. The first major support is near the $2,410 level.
If there is a downside break below the $2,410 support, the price might decline further. In the stated case, the price might drop toward the $2,390 support.
On the upside, there is a key bearish trend line forming with resistance near $2,450 and the 50-hour simple moving average. The next major resistance is near the $2,485 level. The main resistance could be $2,500, above which the price could test the $2,520 resistance. The next major resistance is $2,550.
An upside break above the $2,550 resistance could send Gold price toward $2,580. Any more gains may perhaps set the pace for an increase toward the $2,600 level.
Oil Price Technical Analysis
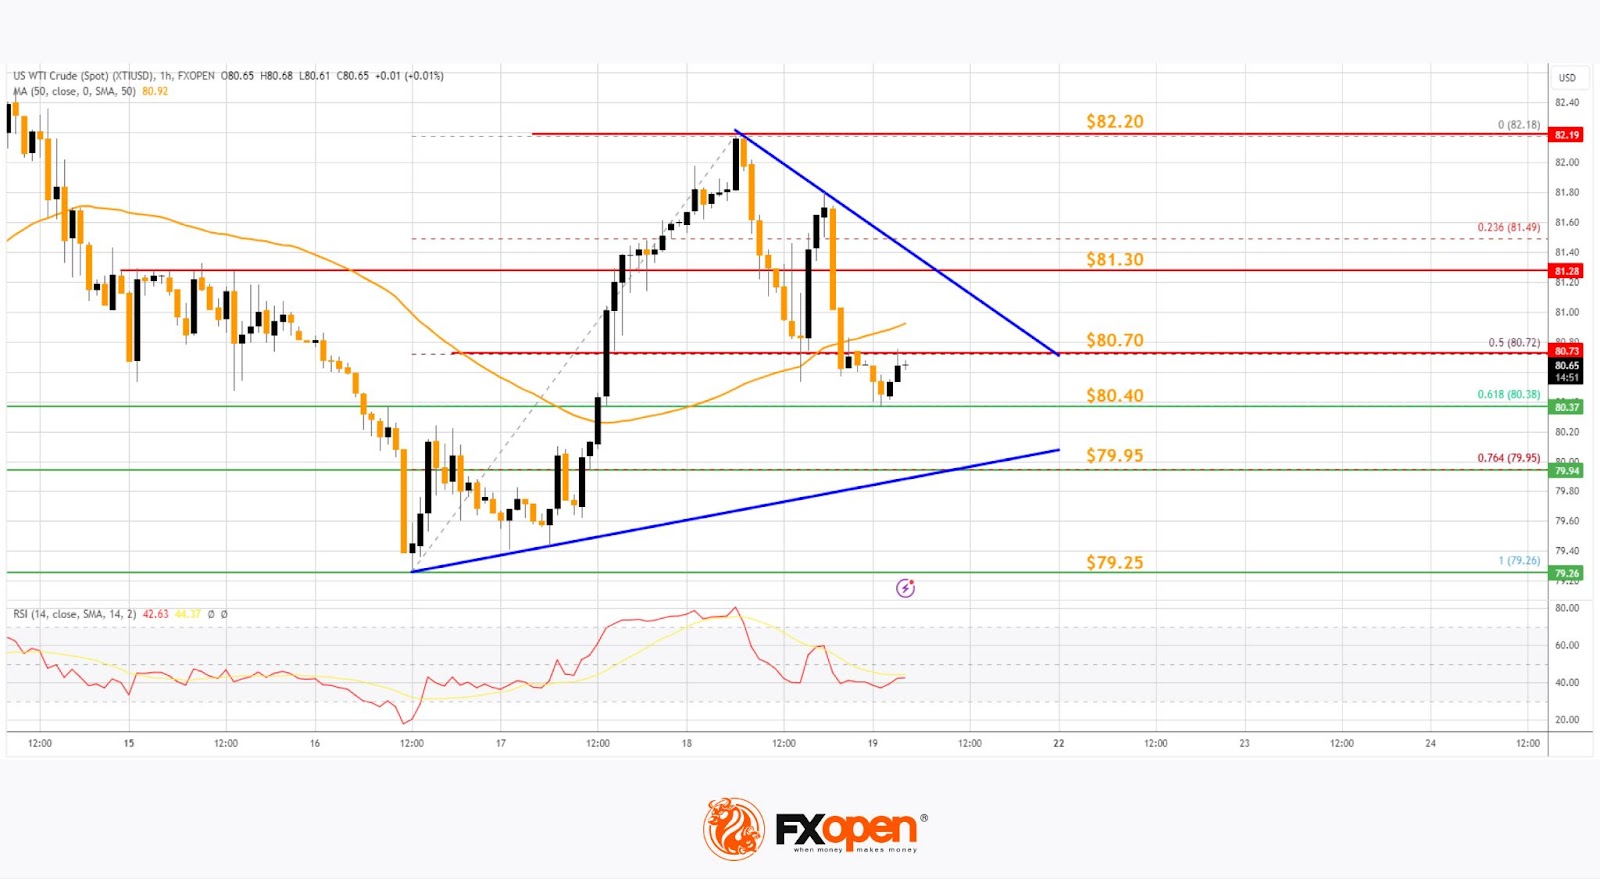
On the hourly chart of WTI Crude Oil at FXOpen, the price struggled to continue higher above $82.20 against the US Dollar. The price formed a short-term top and started a fresh decline below $81.30.
The bears even pushed the price below $80.70 and the 50-hour simple moving average. The price even declined below the 50% Fib retracement level of the upward move from the $79.25 swing low to the $82.18 high.
The price tested the $80.40 support zone and the 61.8% Fib retracement level of the upward move from the $79.25 swing low to the $82.18 high.
Immediate support is near the $80.40 level. The next major support on the WTI crude oil chart is near $79.95. If there is a downside break, the price might decline toward $79.25. Any more losses may perhaps open the doors for a move toward the $78.00 support zone.
On the upside, immediate resistance is near a major contracting triangle at $80.70 and the 50-hour simple moving average. The next resistance is near the $81.30 level.
The main resistance is near a trend line at $82.20. A clear move above the $82.20 zone could send the price toward $82.50. The next key resistance is near $83.20. If the price climbs further higher, it could face resistance near $84.50. Any more gains might send the price toward the $85.00 level.
Start trading commodity CFDs with tight spreads (additional fees may apply). Open your trading account now or learn more about trading commodity CFDs with FXOpen.
This article represents the opinion of the Companies operating under the FXOpen brand only. It is not to be construed as an offer, solicitation, or recommendation with respect to products and services provided by the Companies operating under the FXOpen brand, nor is it to be considered financial advice.
Stay ahead of the market!
Subscribe now to our mailing list and receive the latest market news and insights delivered directly to your inbox.


Latest articles

GBP/USD and EUR/GBP Await Key Bank of England Decision
The pound strengthened following the outcome of the US Federal Reserve meeting, where the central bank, as expected, kept interest rates unchanged. However, the Fed did not provide the market with clear signals of an imminent shift towards rate cuts,

Microsoft Analysis: Earnings Beat Expectations
On 29 July 2026, Microsoft reported its results for the fourth quarter of fiscal year 2026. Revenue reached $90 billion, up 18% year-on-year, while adjusted earnings per share came in at $4.74, comfortably ahead of analysts' expectations of $4.

EUR/USD: All Eyes on the Fed as the Range Reaches Its Breaking Point
The dollar's next move hinges on tonight's Fed decision, and this time markets genuinely don't know what to expect. While economists still lean toward a hold—with CME FedWatch odds sitting near 68.5% for no change—Kevin Warsh's hawkish