


FXOpen

Gold price started a fresh surge above $2,550. Crude oil is recovering and might rise toward the $70.25 resistance zone.
Important Takeaways for Gold and Oil Prices Analysis Today
· Gold price started a strong increase from the $2,500 zone against the US Dollar.
· A major bullish trend line is forming with support at $2,528 on the hourly chart of gold at FXOpen.
· Crude oil is recovering losses and trading above the $67.00 support.
· There was a break above a connecting bearish trend line with resistance near $67.00 on the hourly chart of XTI/USD at FXOpen.
Gold Price Technical Analysis
On the hourly chart of Gold at FXOpen, the price formed support near the $2,500 zone. The price remained in a bullish zone and started a fresh increase above $2,520.
The bulls even pushed the price above the $2,550 level and the 50-hour simple moving average. Finally, it traded to a new all-time high at $2,570. The price is now consolidating gains near the $2,570 zone and the RSI is above 75.
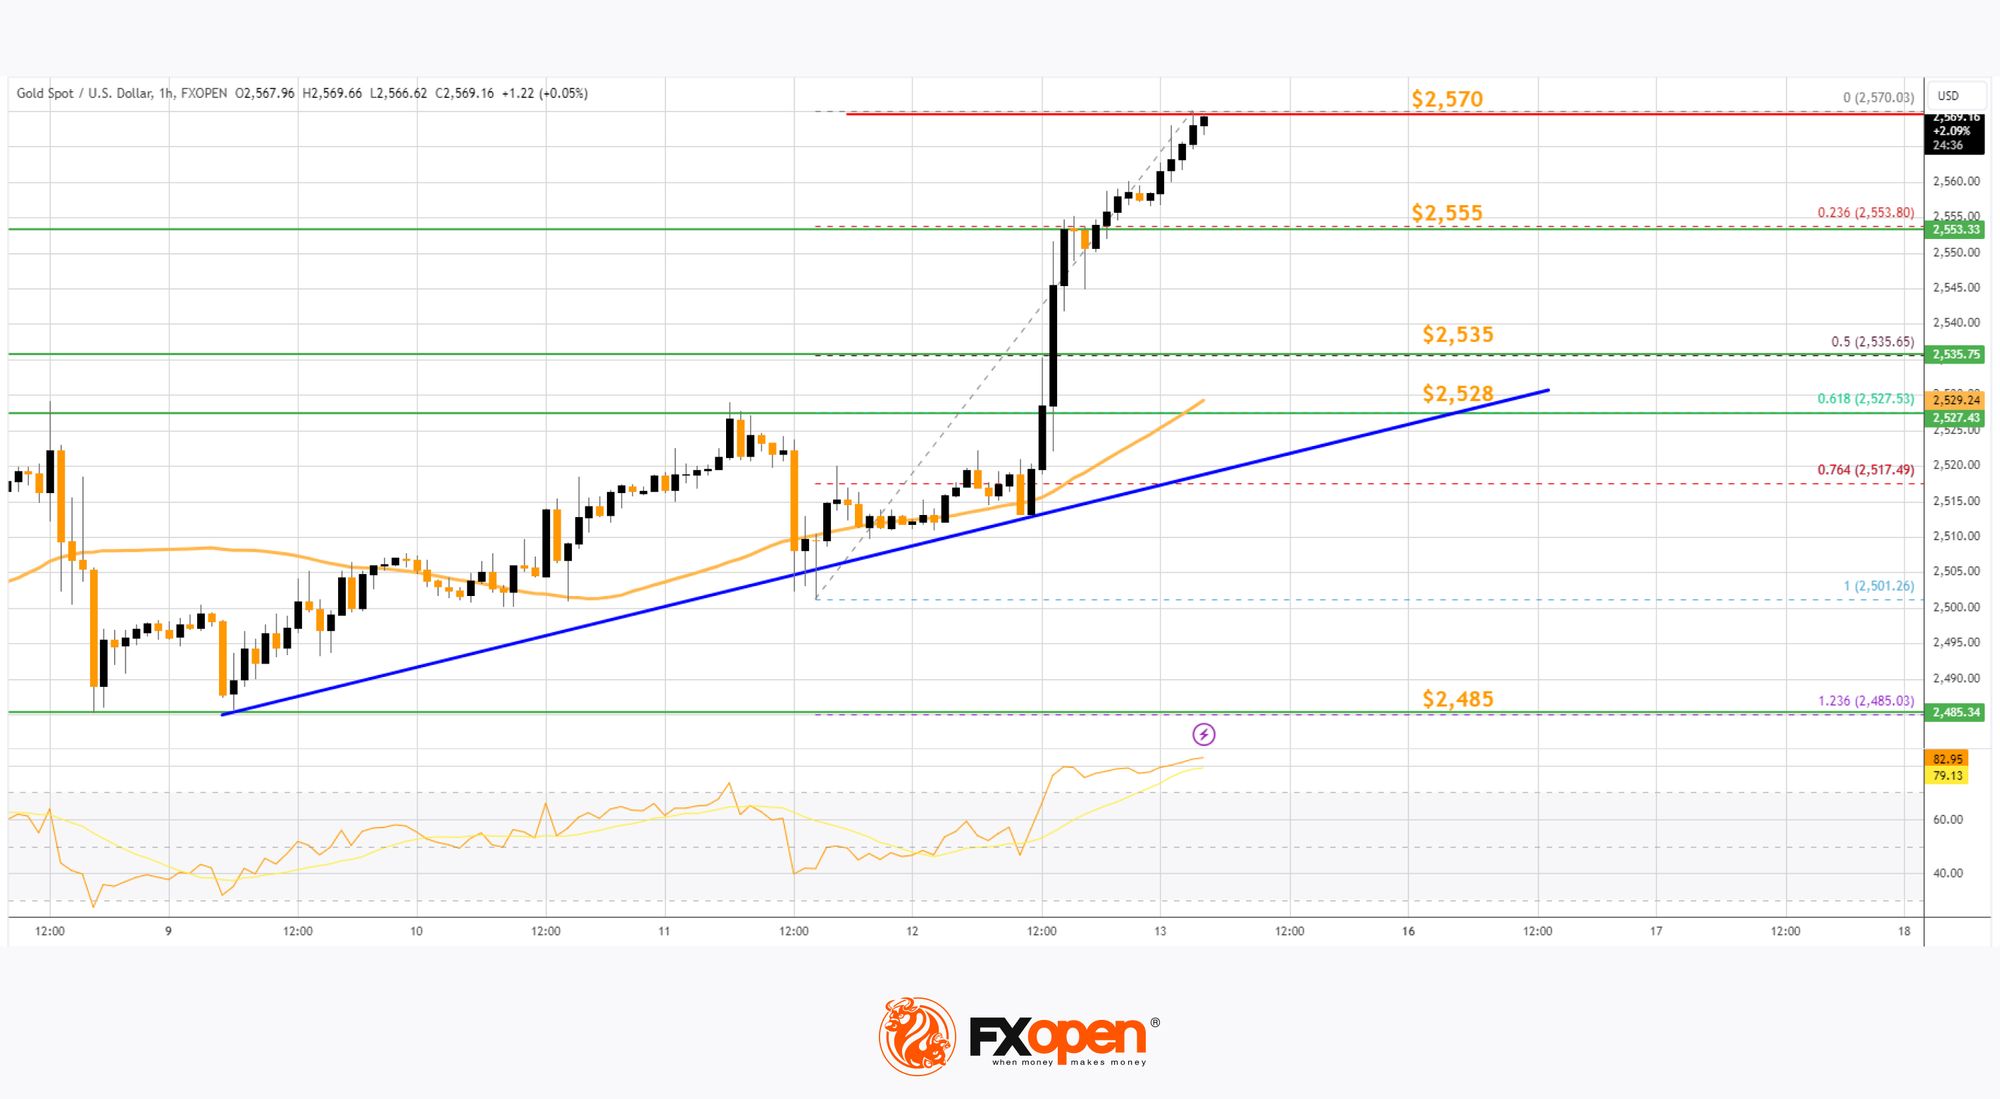
Initial support on the downside is near the 23.6% Fib retracement level of the upward move from the $2,501 swing low to the $2,570 high at $2,555.
The first major support is near the $2,535 zone. The main support is near a bullish trend line at $2,528 and the 50-hour simple moving average. It is close to the 61.8% Fib retracement level of the upward move from the $2,501 swing low to the $2,570 high.
If there is a downside break below the $2,528 support, the price might decline further. In the stated case, the price might drop toward the $2,485 support.
Immediate resistance is near the $2,570 level. The next major resistance is near the $2,580 level. An upside break above the $2,580 resistance could send Gold price toward $2,592. Any more gains may perhaps set the pace for an increase toward the $2,600 level.
Read analytical Gold price forecasts for 2024 and beyond.
Oil Price Technical Analysis
On the hourly chart of WTI Crude Oil at FXOpen, the price found support near the $64.75 zone against the US Dollar. The price formed a base and started a recovery wave above $66.00 and the 50-hour simple moving average.
The bulls were able to push the price toward the 50% Fib retracement level of the downward move from the $70.27 swing high to the $64.74 swing low. Besides, there was a break above a connecting bearish trend line with resistance near $67.00.
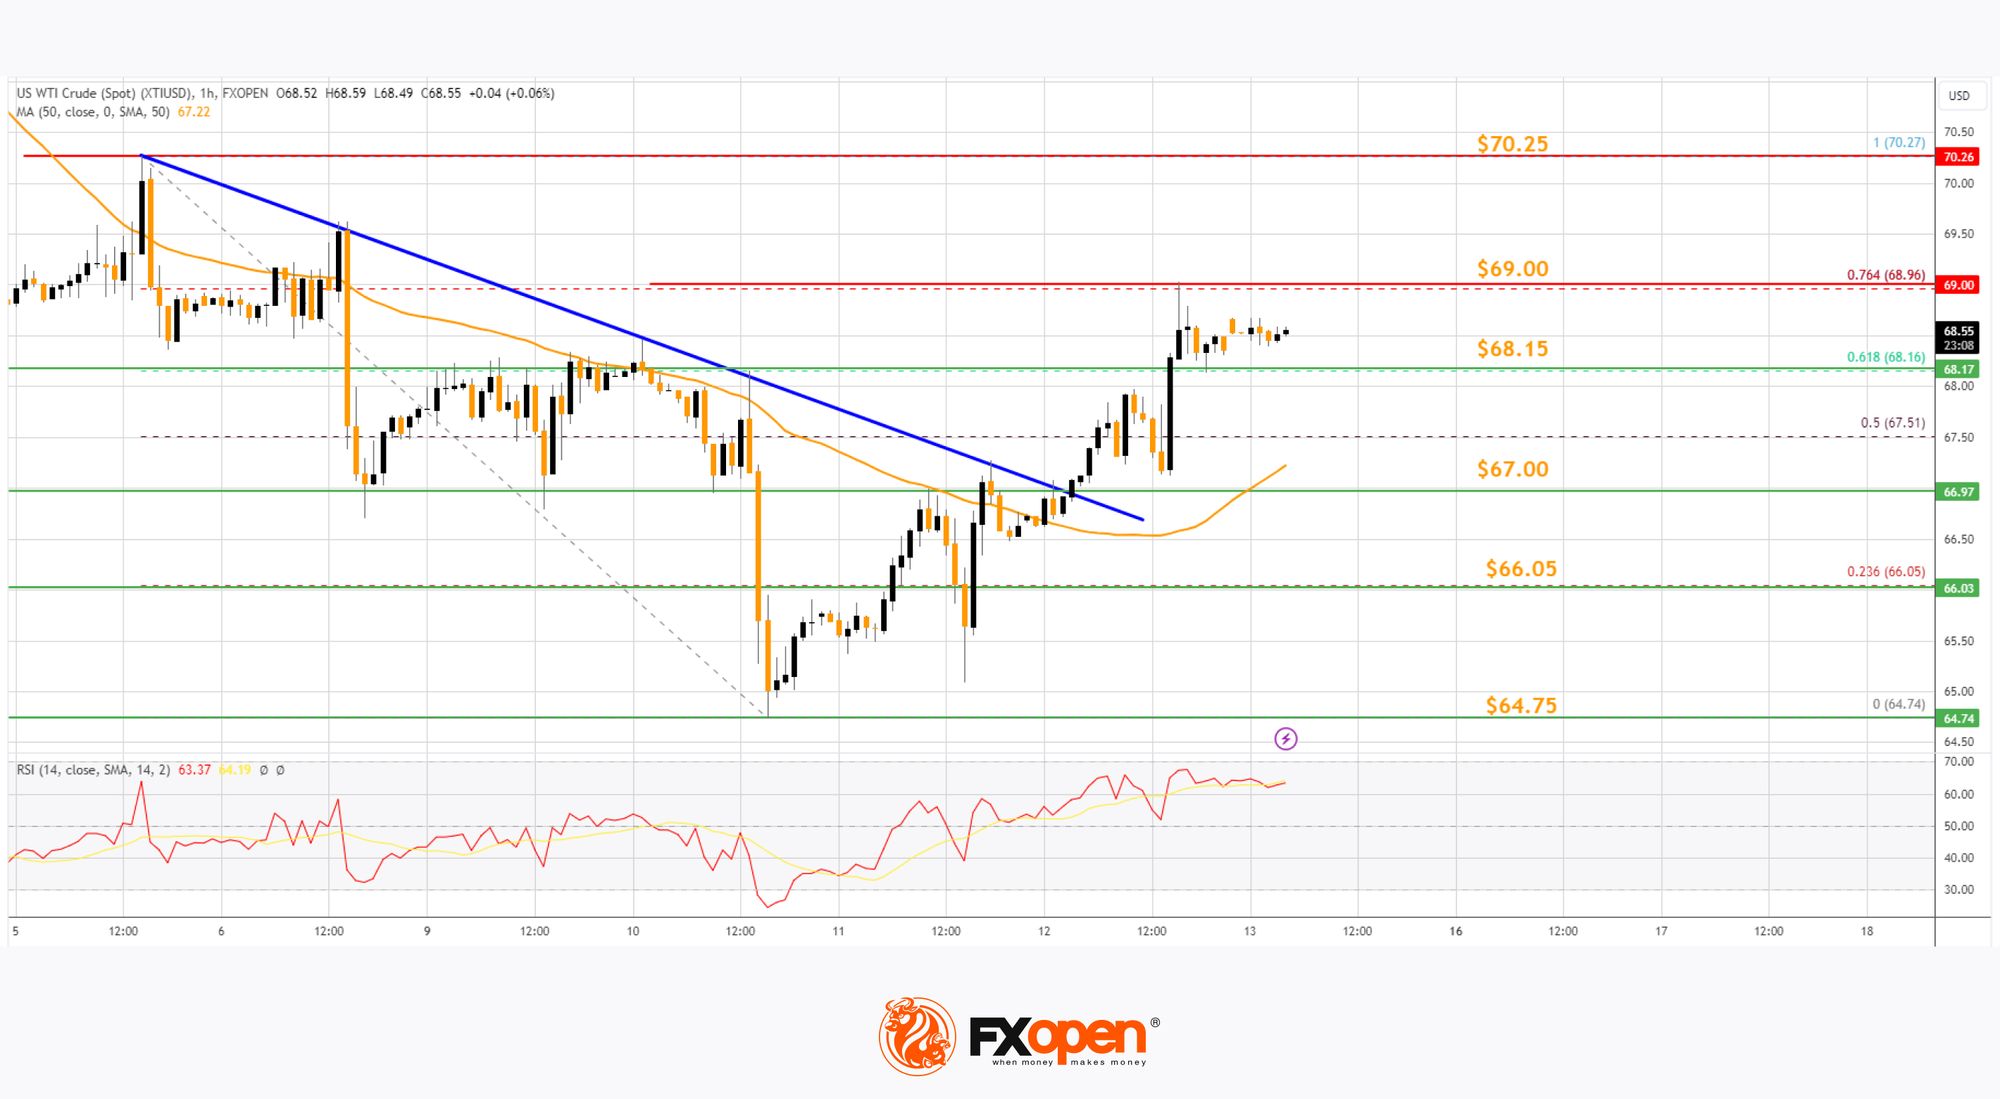
The hourly RSI is near the 65 level, but the price is struggling near $69.00, and the 76.4% Fib retracement level of the downward move from the $70.27 swing high to the $64.74 swing low.
The next resistance is near the $70.25 level. A clear move above the $70.25 could send the price toward the $71.50 resistance. Any more gains might send the price toward the $72.40 level. Conversely, the price might start a fresh decline from the $69.00 resistance.
Immediate support sits near the $68.15 level. The next major support on the WTI crude oil chart is $67.00. If there is a downside break, the price might decline toward $66.05. Any more losses may perhaps open the doors for a move toward the $64.75 support zone.
Start trading commodity CFDs with tight spreads (additional fees may apply). Open your trading account now or learn more about trading commodity CFDs with FXOpen.
This article represents the opinion of the Companies operating under the FXOpen brand only. It is not to be construed as an offer, solicitation, or recommendation with respect to products and services provided by the Companies operating under the FXOpen brand, nor is it to be considered financial advice.
Stay ahead of the market!
Subscribe now to our mailing list and receive the latest market news and insights delivered directly to your inbox.


Latest articles

European Currencies Decline: Pound Hits New Lows, Euro Under Pressure
European currencies continue to weaken against the US dollar amid rising geopolitical tensions and increased demand for safe-haven and liquid assets. Market participants are reducing exposure to riskier instruments, putting pressure on both the euro and the pound. Additional support

Market Analysis: GBP/USD Dips Further As EUR/GBP Regains Traction
GBP/USD failed to climb above 1.3500 and corrected some gains. EUR/GBP started a decent increase and might aim for more gains above 0.8700.
Important Takeaways for GBP/USD and EUR/GBP Analysis Today
· The British Pound
