


FXOpen

Gold price started another increase and surpassed the $2,440 resistance. Crude oil is showing bearish signs and might decline below $75.00.
Important Takeaways for Gold and Oil Prices Analysis Today
· Gold price started a steady increase from the $2,420 zone against the US Dollar.
· A key bullish trend line is forming with support near $2,440 on the hourly chart of gold at FXOpen.
· Crude oil prices failed to clear the $78.20 region and started a fresh decline.
· There was a break below a connecting bullish trend line with support at $77.50 on the hourly chart of XTI/USD at FXOpen.
Gold Price Technical Analysis
On the hourly chart of Gold at FXOpen, the price found support near the $2,320 zone. The price remained in a bullish zone and started a strong increase above $2,400.
There was a decent move above the 50-hour simple moving average and $2,420. The bulls pushed the price above the $2,435 and $2,440 resistance levels. Finally, the price tested the $2,455 zone and the price is now consolidating losses.
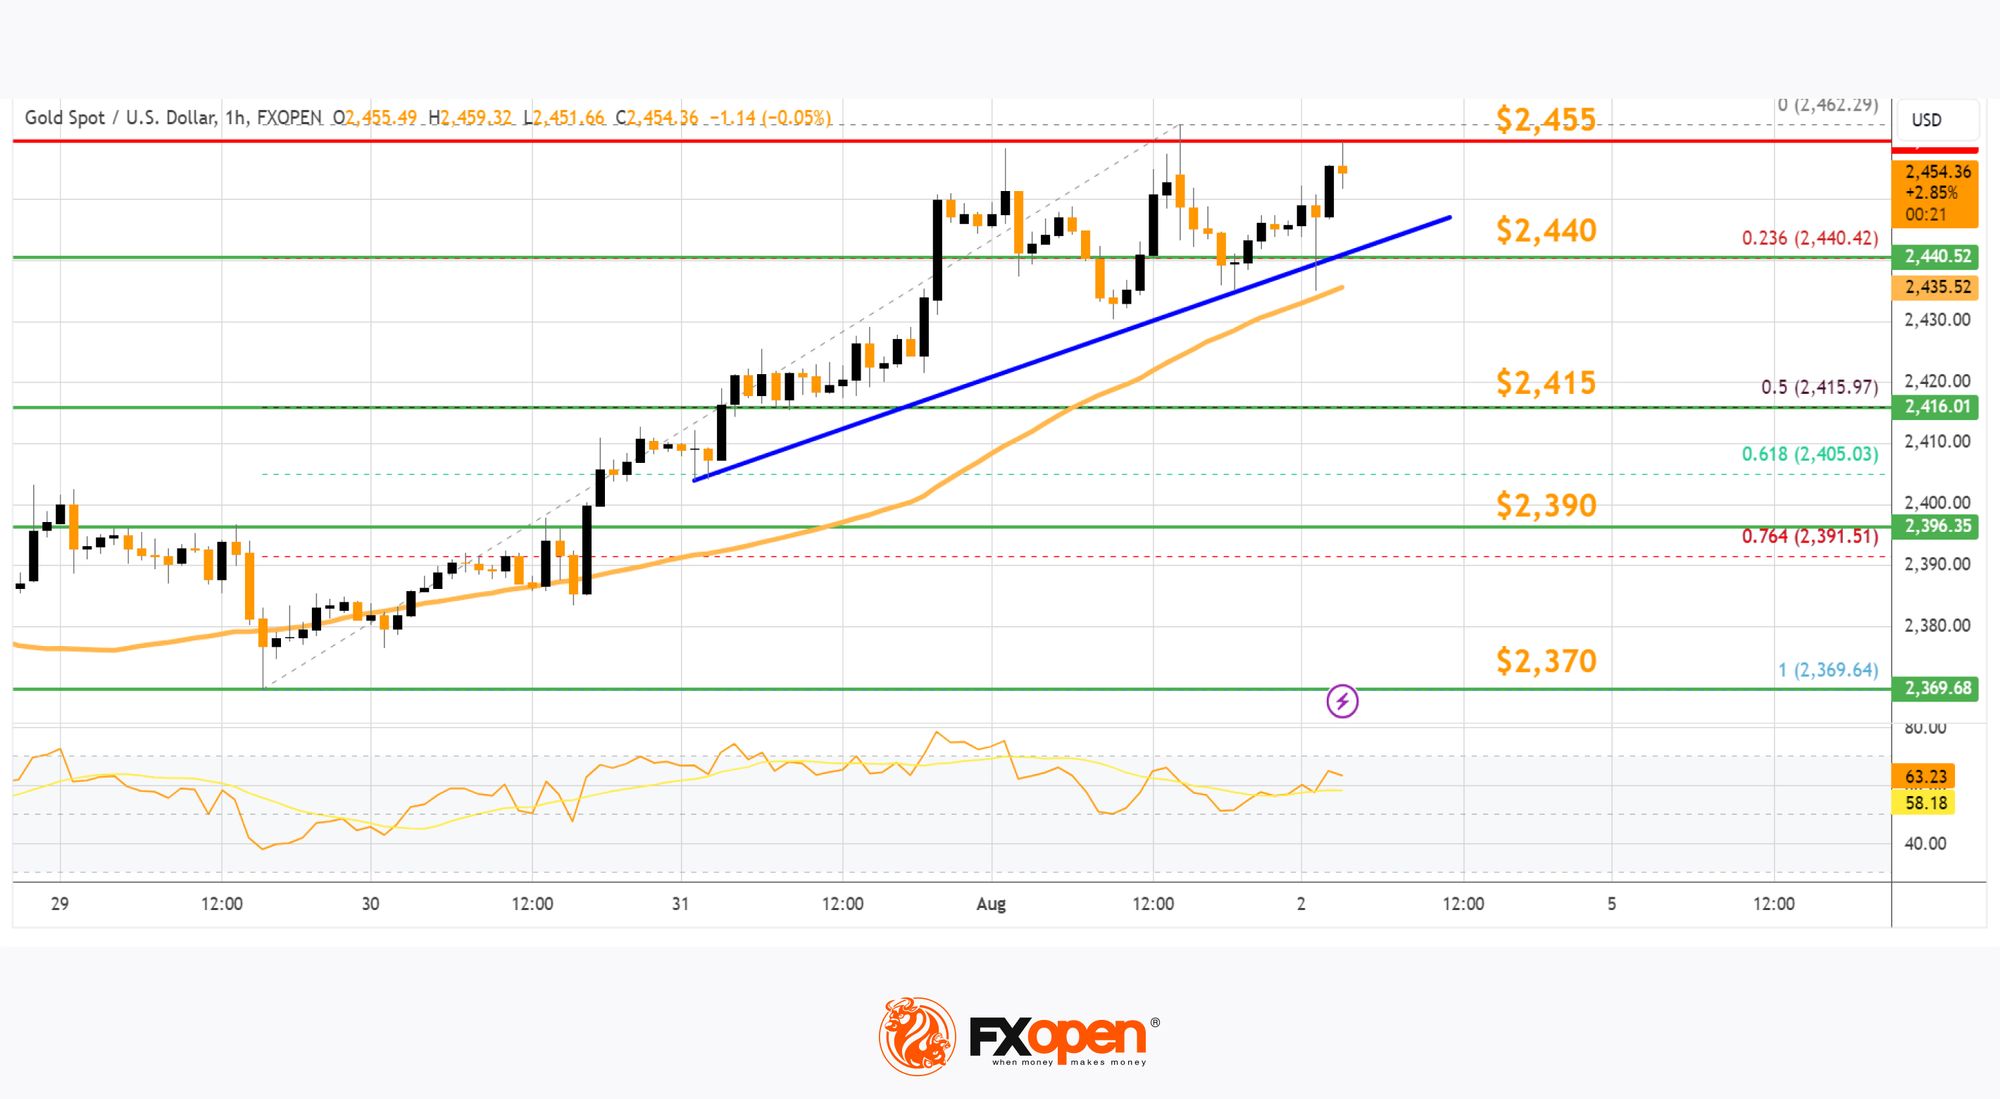
The price is showing positive signs above the 23.6% Fib retracement level of the upward move from the $2,369 swing low to the $2,462 high, and the RSI is stable above 50.
Initial support on the downside is near $2,440. There is also a key bullish trend line forming with support near $2,440 and the 50-hour simple moving average. The first major support is near the $2,415 zone. It is close to the 50% Fib retracement level of the upward move from the $2,369 swing low to the $2,462 high.
If there is a downside break below the $2,415 support, the price might decline further. In the stated case, the price might drop toward the $2,390 support.
Immediate resistance is near the $2,445 level. The next major resistance is near the $2,450 level. An upside break above the $2,450 resistance could send Gold price toward $2,460. Any more gains may perhaps set the pace for an increase toward the $2,480 level.
Oil Price Technical Analysis
On the hourly chart of WTI Crude Oil at FXOpen, the price struggled to clear the $78.20 resistance zone against the US Dollar. The price started a fresh decline below the $77.00 support.
There was a break below a connecting bullish trend line with support at $77.50. There was a steady decline below the 50% Fib retracement level of the upward move from the $74.23 swing low to the $78.25 high.
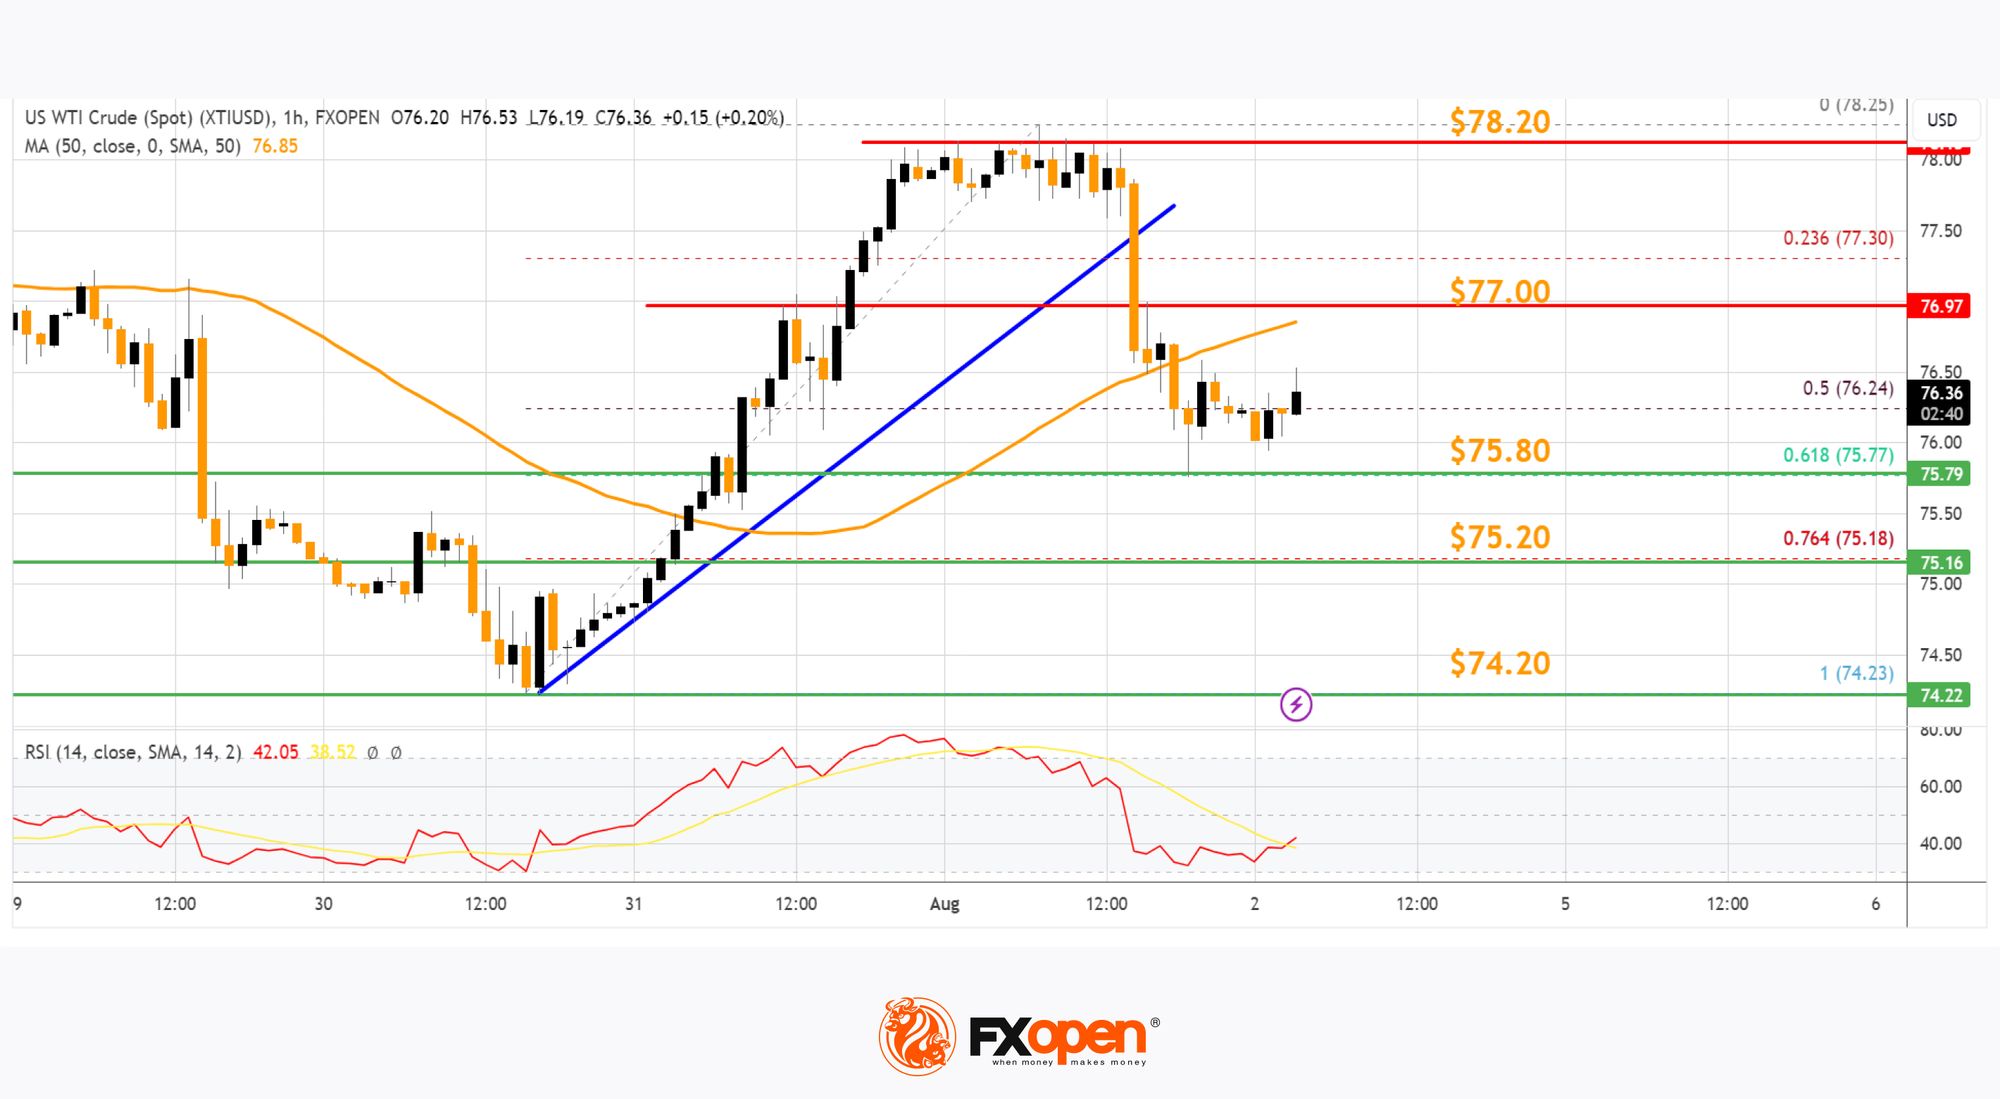
The pair is now consolidating below the 50-hour simple moving average. Finally, the price tested the 61.8% Fib retracement level of the upward move from the $74.23 swing low to the $78.25 high.
If there is a fresh increase, it could face resistance near $77.00 and the 50-hour simple moving average. The first major resistance is near the $78.20 level. Any more gains might send the price toward the $79.50 level. Any more gains might call for a test of $80.00.
Conversely, the price might continue to move down and revisit the $75.20 support. The next major support on the WTI crude oil chart is $74.20.
If there is a downside break, the price might decline toward $73.50. Any more losses may perhaps open the doors for a move toward the $72.50 support zone.
Start trading commodity CFDs with tight spreads (additional fees may apply). Open your trading account now or learn more about trading commodity CFDs with FXOpen.
This article represents the opinion of the Companies operating under the FXOpen brand only. It is not to be construed as an offer, solicitation, or recommendation with respect to products and services provided by the Companies operating under the FXOpen brand, nor is it to be considered financial advice.
Stay ahead of the market!
Subscribe now to our mailing list and receive the latest market news and insights delivered directly to your inbox.


Latest articles

Gold Price Holds Near Key Support
As the XAU/USD chart shows, the gold price has been holding within the $5,060–$5,200 range over the past several sessions.
Bullish view: the key support is the lower boundary of the long-term channel that has been

EUR/USD Chart Analysis: Pair Rebounds from the Year’s Low
Analysing the EUR/USD chart five days ago, we:
→ constructed a downward channel, noting signs that the bears remained in control;
→ outlined a scenario in which the rate would decline to a new yearly low (and test the lower boundary

Dollar Index (DXY) Hits Yearly High
Today, the dollar index rose above last week’s peak around the 99.68 level, setting a new high for 2026. This movement is supported by a tense fundamental backdrop:
→ Inflationary pressures from rising oil prices. Markets may be pricing