


Market Analysis: Gold Price Retreats Modestly, Oil Price Gains Traction
FXOpen
Gold price rallied above $4,250 before correcting lower. Crude oil price is recovering and it could climb further higher toward $62.00.
Important Takeaways for Gold and Oil Prices Analysis Today
· Gold price gained pace for a move above $4,250 and recently corrected lower against the US Dollar.
· A key bullish trend line is forming with support at $4,195 on the hourly chart of gold at FXOpen.
· Crude oil prices are moving higher above the $59.00 resistance zone.
· There is a connecting bullish trend line forming with support at $59.40 on the hourly chart of XTI/USD at FXOpen.
Gold Price Technical Analysis
On the hourly chart of Gold at FXOpen, the price was able to climb above $4,120, as mentioned in the previous analysis. The price even surpassed $4,250 before the bears appeared.
The price traded close to $4,260 before there was a downside correction. There was a move below $4,240 and $4,220. The price settled below the 50-hour simple moving average, and RSI dipped below 50. There was a move below the 50% Fib retracement level of the upward move from the $4,175 swing low to the $4,260 high.
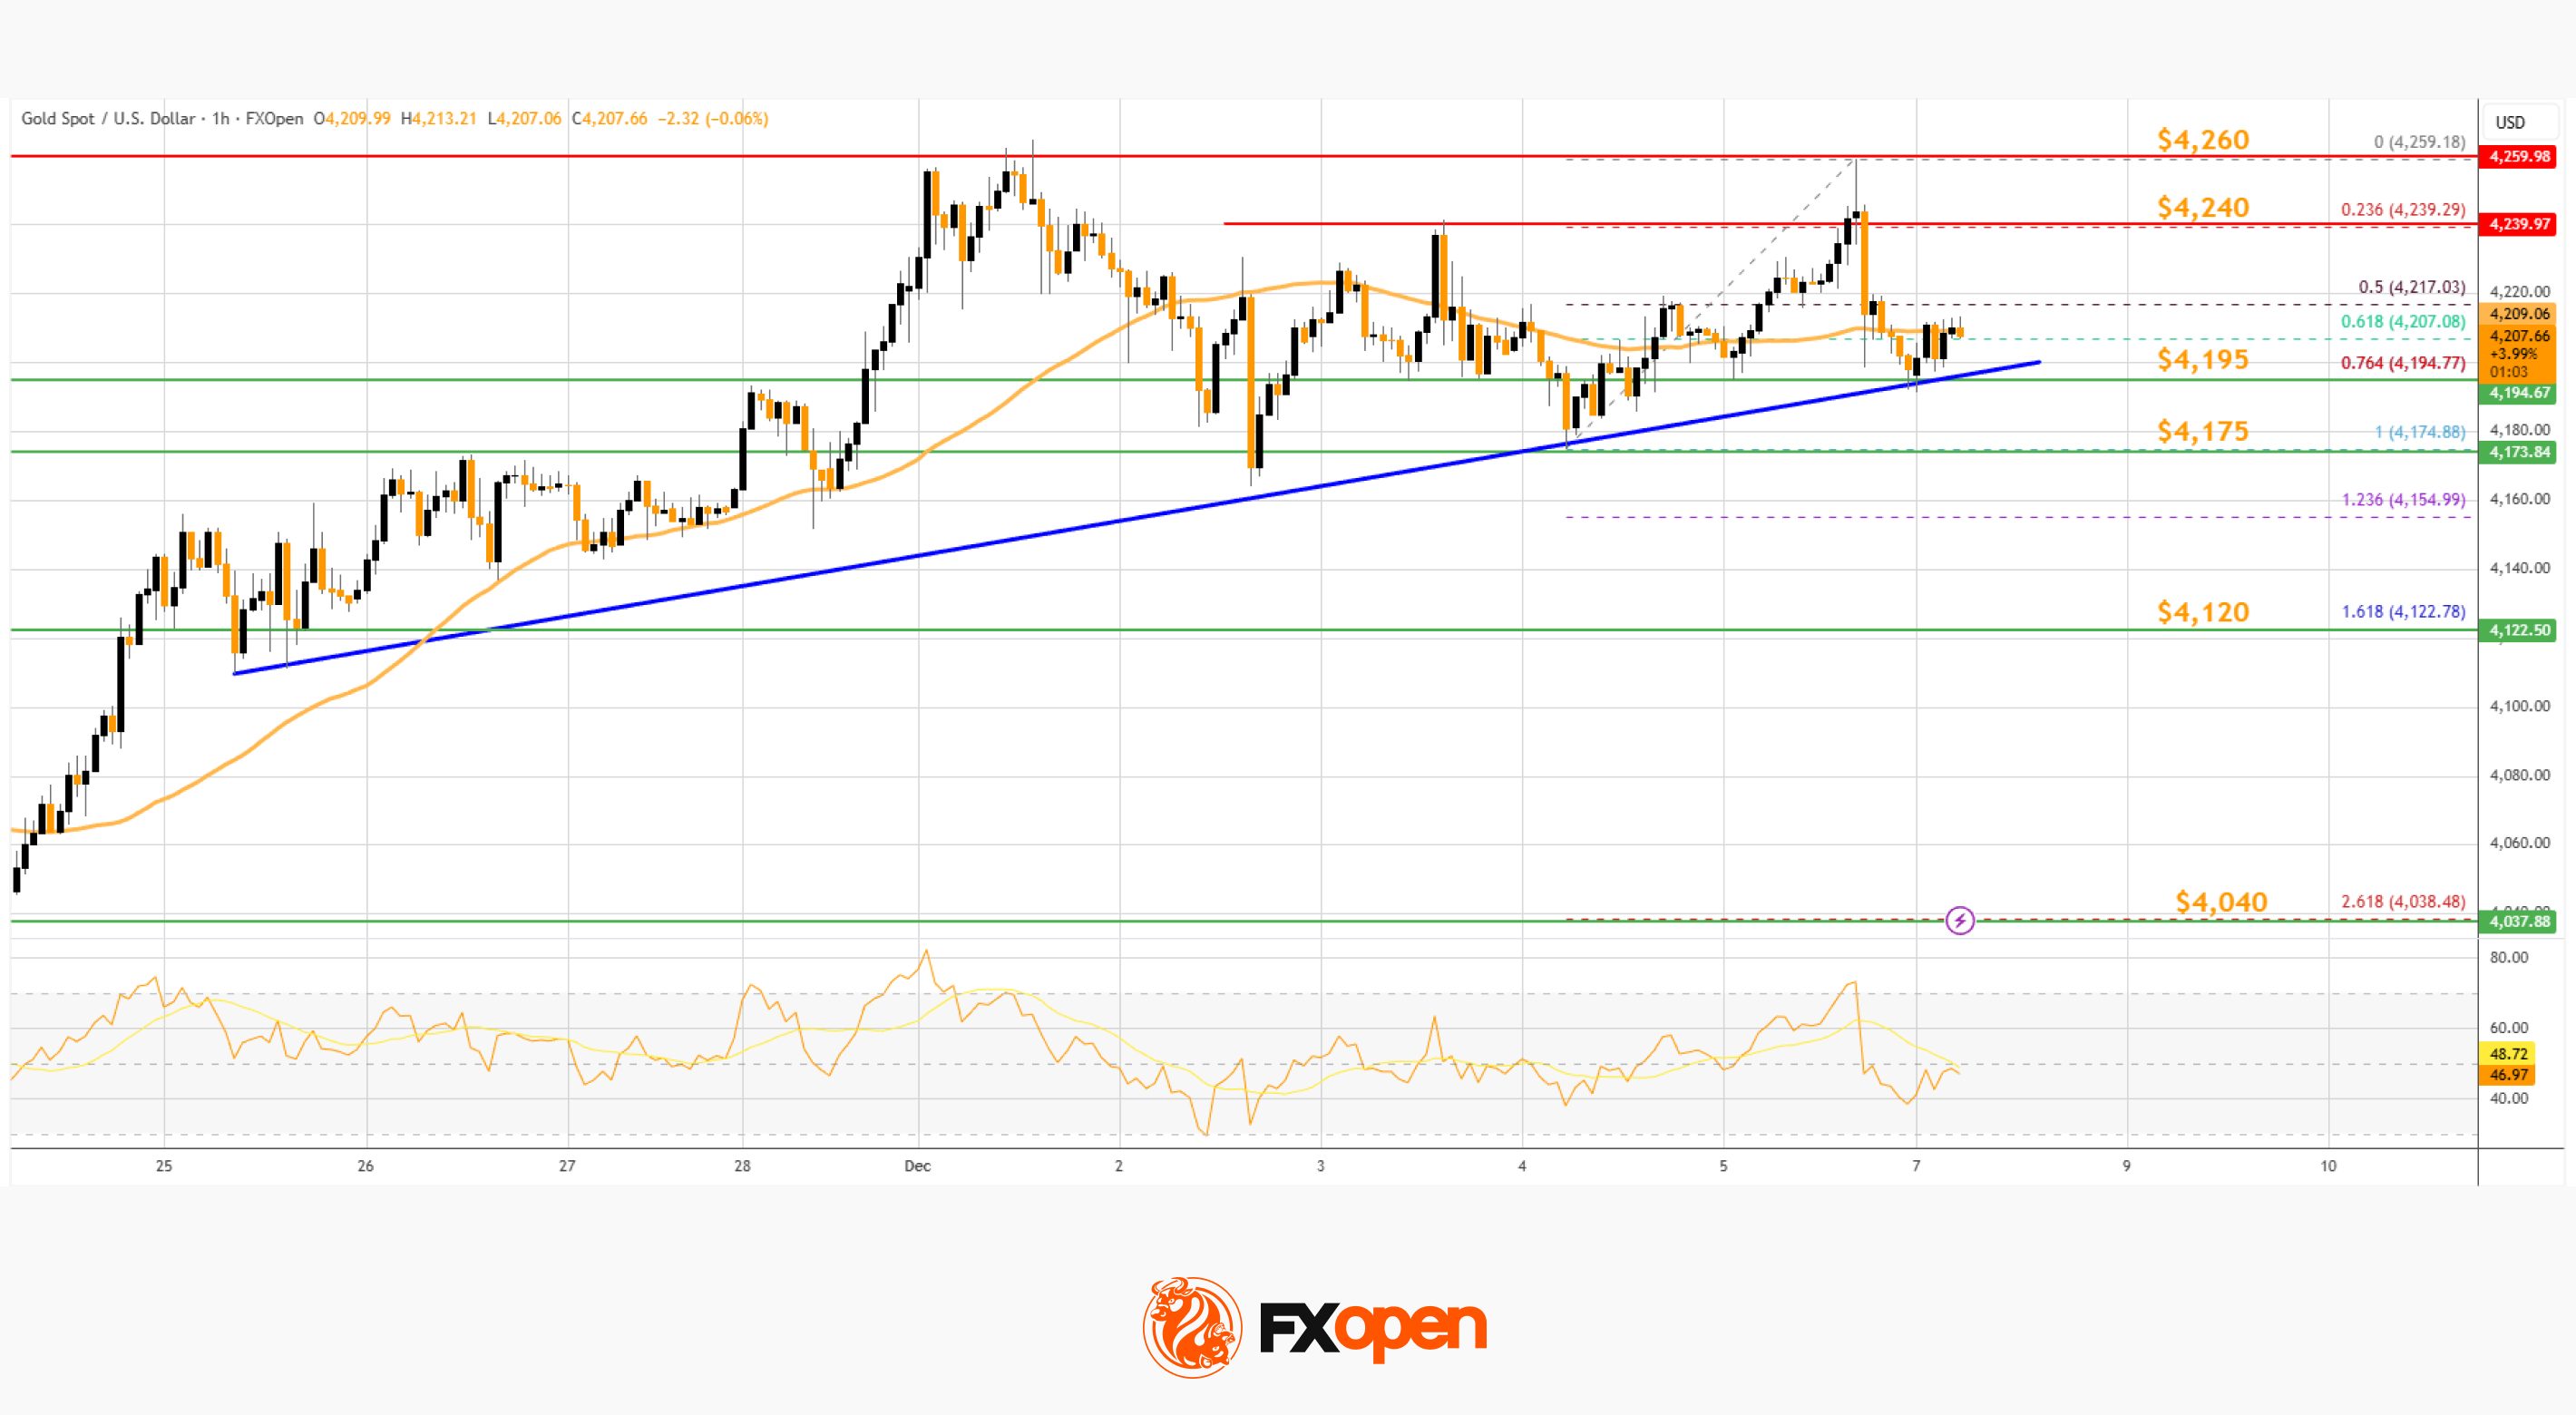
However, the bulls are active above $4,200. There is also a key bullish trend line forming with support at $4,195 and the 76.4% Fib retracement.
Immediate resistance on the upside is $4,240. The next major resistance is $4,260. An upside break above $4,260 could send Gold price toward $4,275. Any more gains may perhaps set the pace for an increase toward $4,290.
If there is no fresh increase, the price could continue to move down. Initial support on the downside is near $4,195 and the trend line. The first key breakdown zone could be $4,175. If there is a downside break below $4,175, the price might decline further. In the stated case, the price might drop to $4,120.
Oil Price Technical Analysis
On the hourly chart of WTI Crude Oil at FXOpen, the price started a decent increase against the US Dollar. The price gained bullish momentum after it settled above $58.20.
The bulls pushed the price above the 50-hour simple moving average, and the RSI climbed toward 70. The price tested the $60.20 zone and is currently consolidating gains. There was a minor pullback below $60.00, and the price tested the 23.6% Fib retracement level of the upward move from the $58.20 swing low to the $60.20 low.
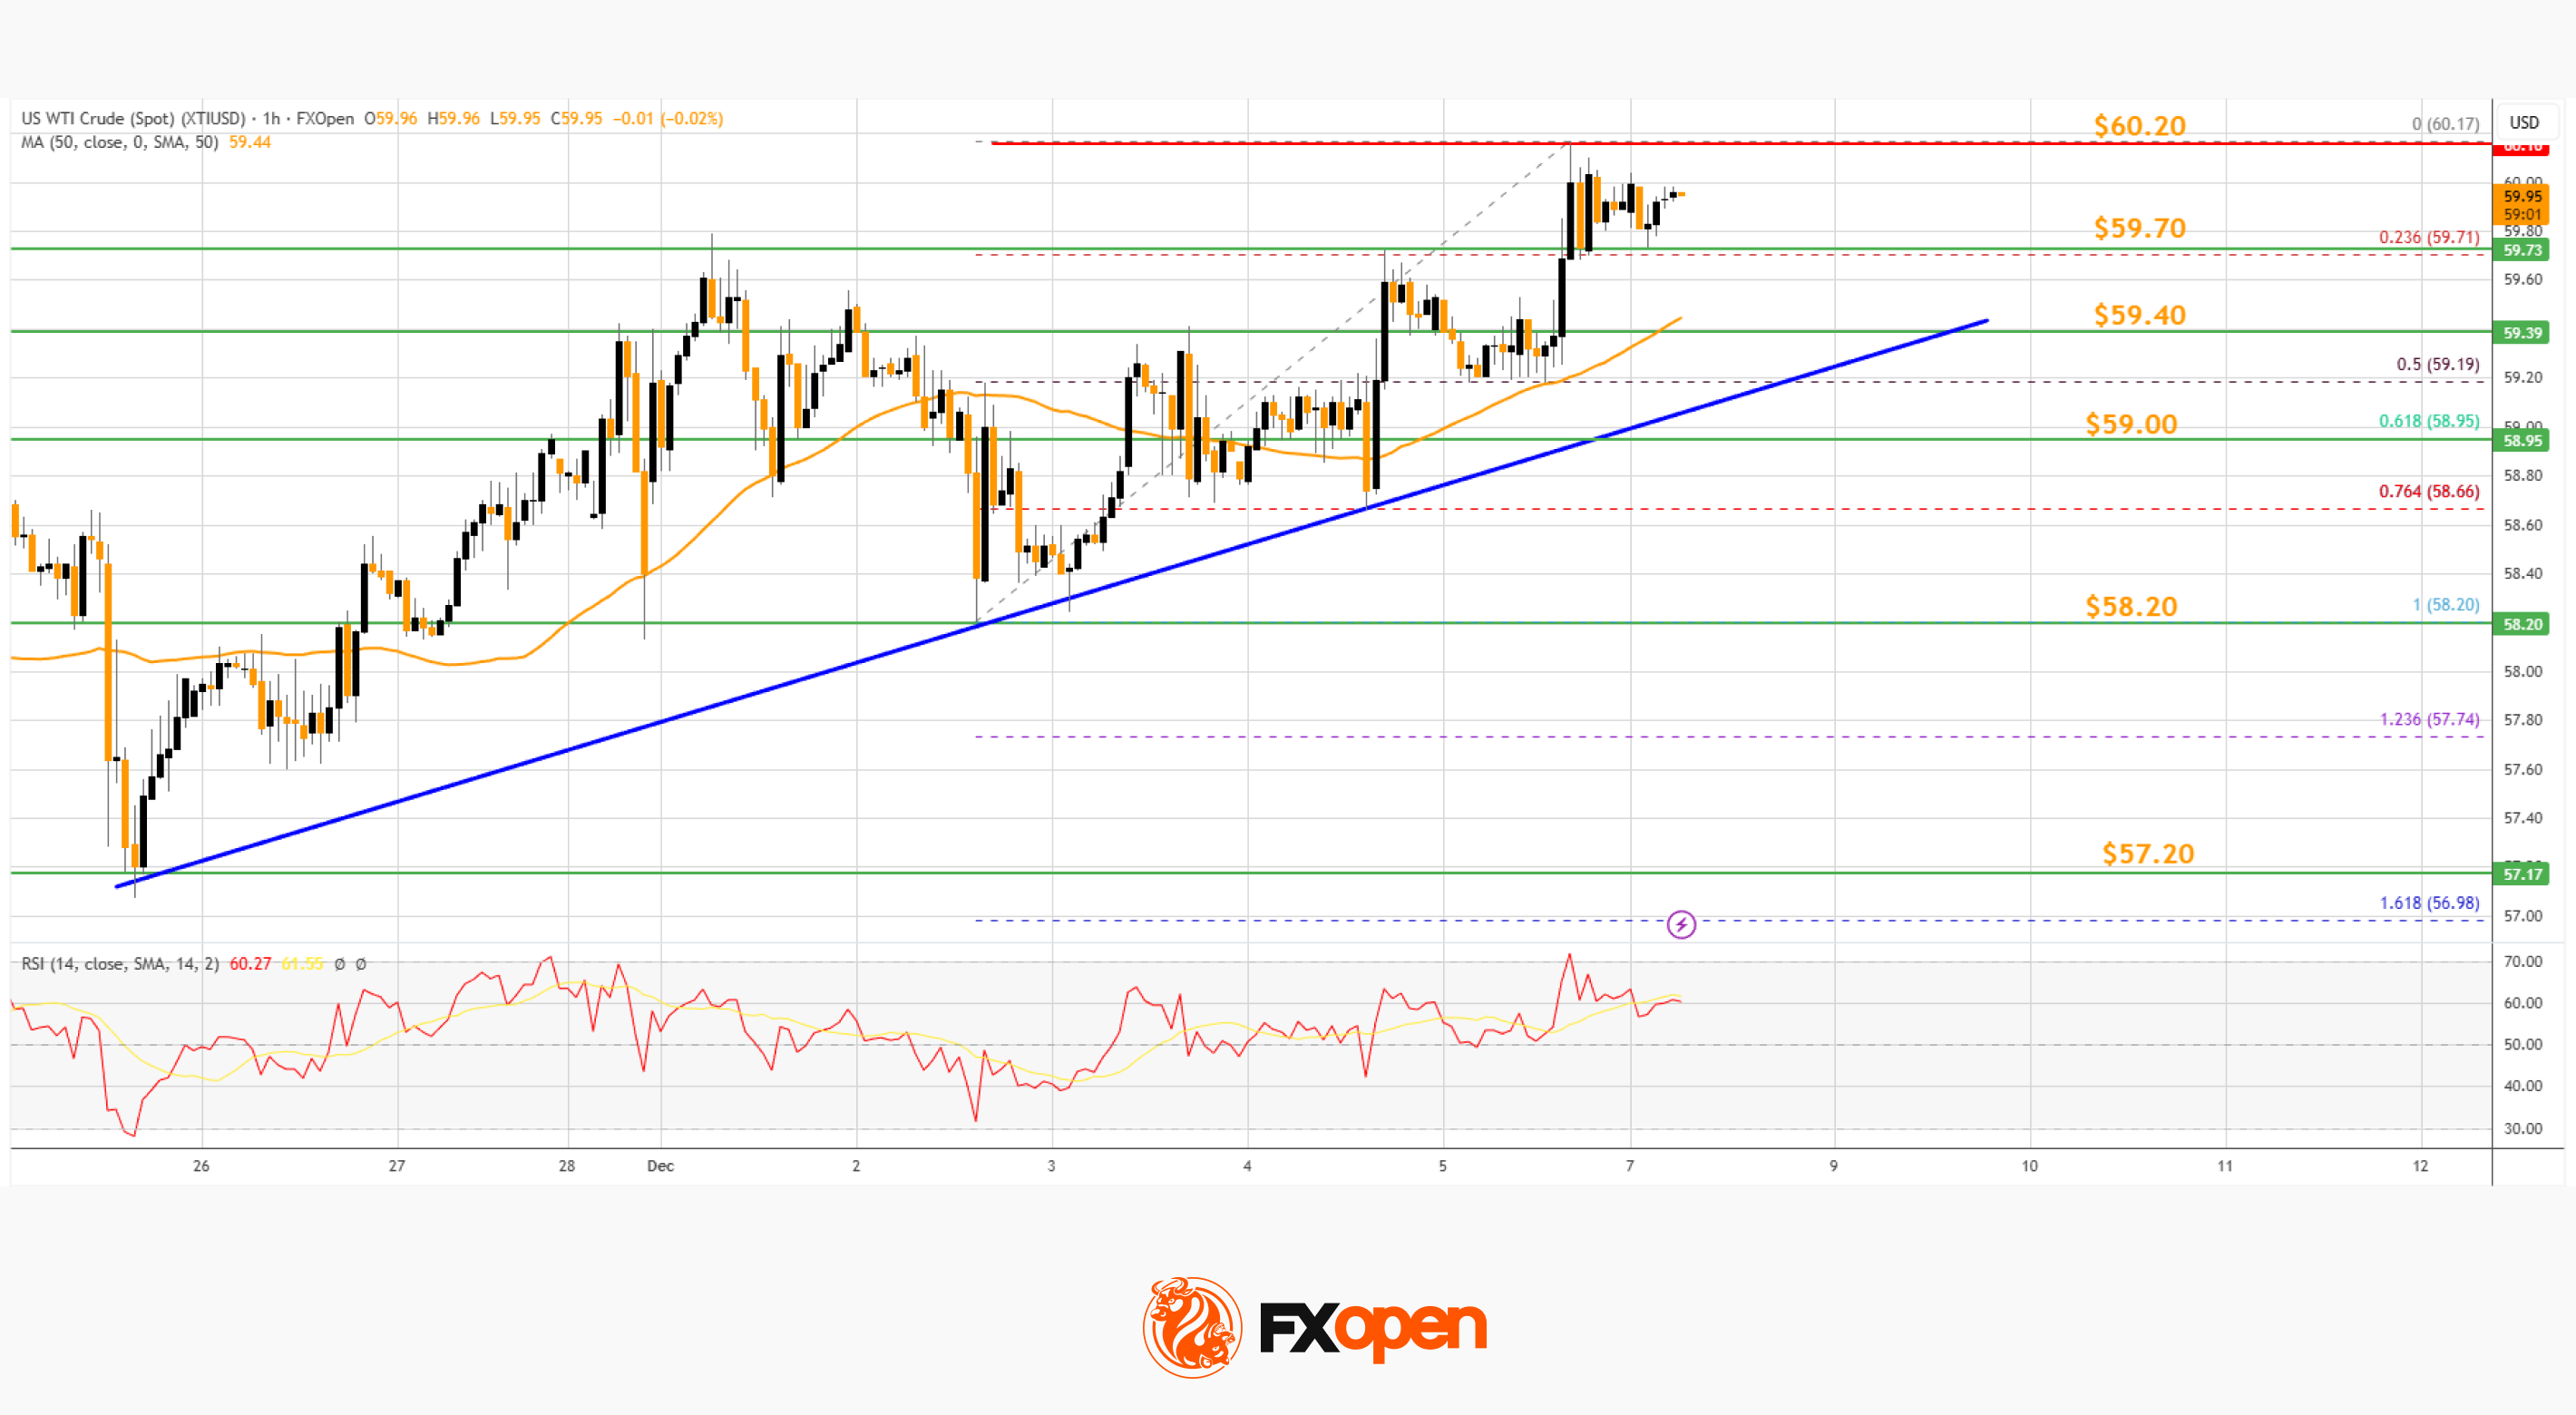
Immediate resistance is near $60.20. If the price climbs further higher, it could face bears near $60.50. The next key area of interest might be $61.20. Any more gains might send the price toward $62.00.
Conversely, the price might correct gains and test $59.40. There is also a connecting bullish trend line forming with support at $59.40 and the 50-hour simple moving average.
The main bid area on the WTI crude oil chart could be $59.00 and the 61.8% Fib retracement. If there is a downside break, the price might decline toward $58.20. Any more losses may perhaps open the doors for a move to $57.20.
Start trading commodity CFDs with tight spreads (additional fees may apply). Open your trading account now or learn more about trading commodity CFDs with FXOpen.
This article represents the opinion of the Companies operating under the FXOpen brand only. It is not to be construed as an offer, solicitation, or recommendation with respect to products and services provided by the Companies operating under the FXOpen brand, nor is it to be considered financial advice.
Stay ahead of the market!
Subscribe now to our mailing list and receive the latest market news and insights delivered directly to your inbox.


Latest articles

US Dollar Index: A Defining Week for the King of the Markets
The dollar heads into a pivotal week trading near 101.80, just off a 15-month high, with the Fed's July 29 meeting standing as the clear focal point. Markets currently price roughly a 65% chance of a hold, though renewed

NZD/USD: Inflation Surge Meets Strong US Dollar Pressure
On 21 July, Stats NZ reported an acceleration in inflation: the Consumer Price Index rose 1.5% in the second quarter, while the annual inflation rate climbed to 4.1%, its highest level in more than two years and slightly

Weekly Market Insights with Gary Thomson: The Week of Central Banks and Earnings
In this video, we’ll explore the key economic events and market trends, shaping the financial landscape. Get ready for insights into financial markets to help you navigate the week ahead. Let’s dive in!
In this episode of Market