


FXOpen

Gold price extended losses below $4,100 before the bulls appeared. Crude oil price is rising and it could climb further higher toward $62.00.
Important Takeaways for Gold and WTI Crude Oil Prices Analysis Today
· Gold price failed to clear $4,250 and corrected lower against the US Dollar.
· There was a break above a key bearish trend line with resistance at $4,050 on the hourly chart of gold at FXOpen.
· WTI Crude oil prices are moving higher above the $60.00 resistance zone.
· There is a key bullish trend line forming with support near $59.80 on the hourly chart of XTI/USD at FXOpen.
Gold Price Technical Analysis
On the hourly chart of Gold at FXOpen, the price was able to climb above $4,200. The price even broke $4,220 before the bears appeared. The price traded toward $4,245 before there was a fresh decline.
There was a move below $4,200 and $4,100. The price settled below the 50-hour simple moving average, and RSI dipped below 40. Finally, it tested the $4,000 handle. A low was formed at $3,997 and the price is now attempting to recover.
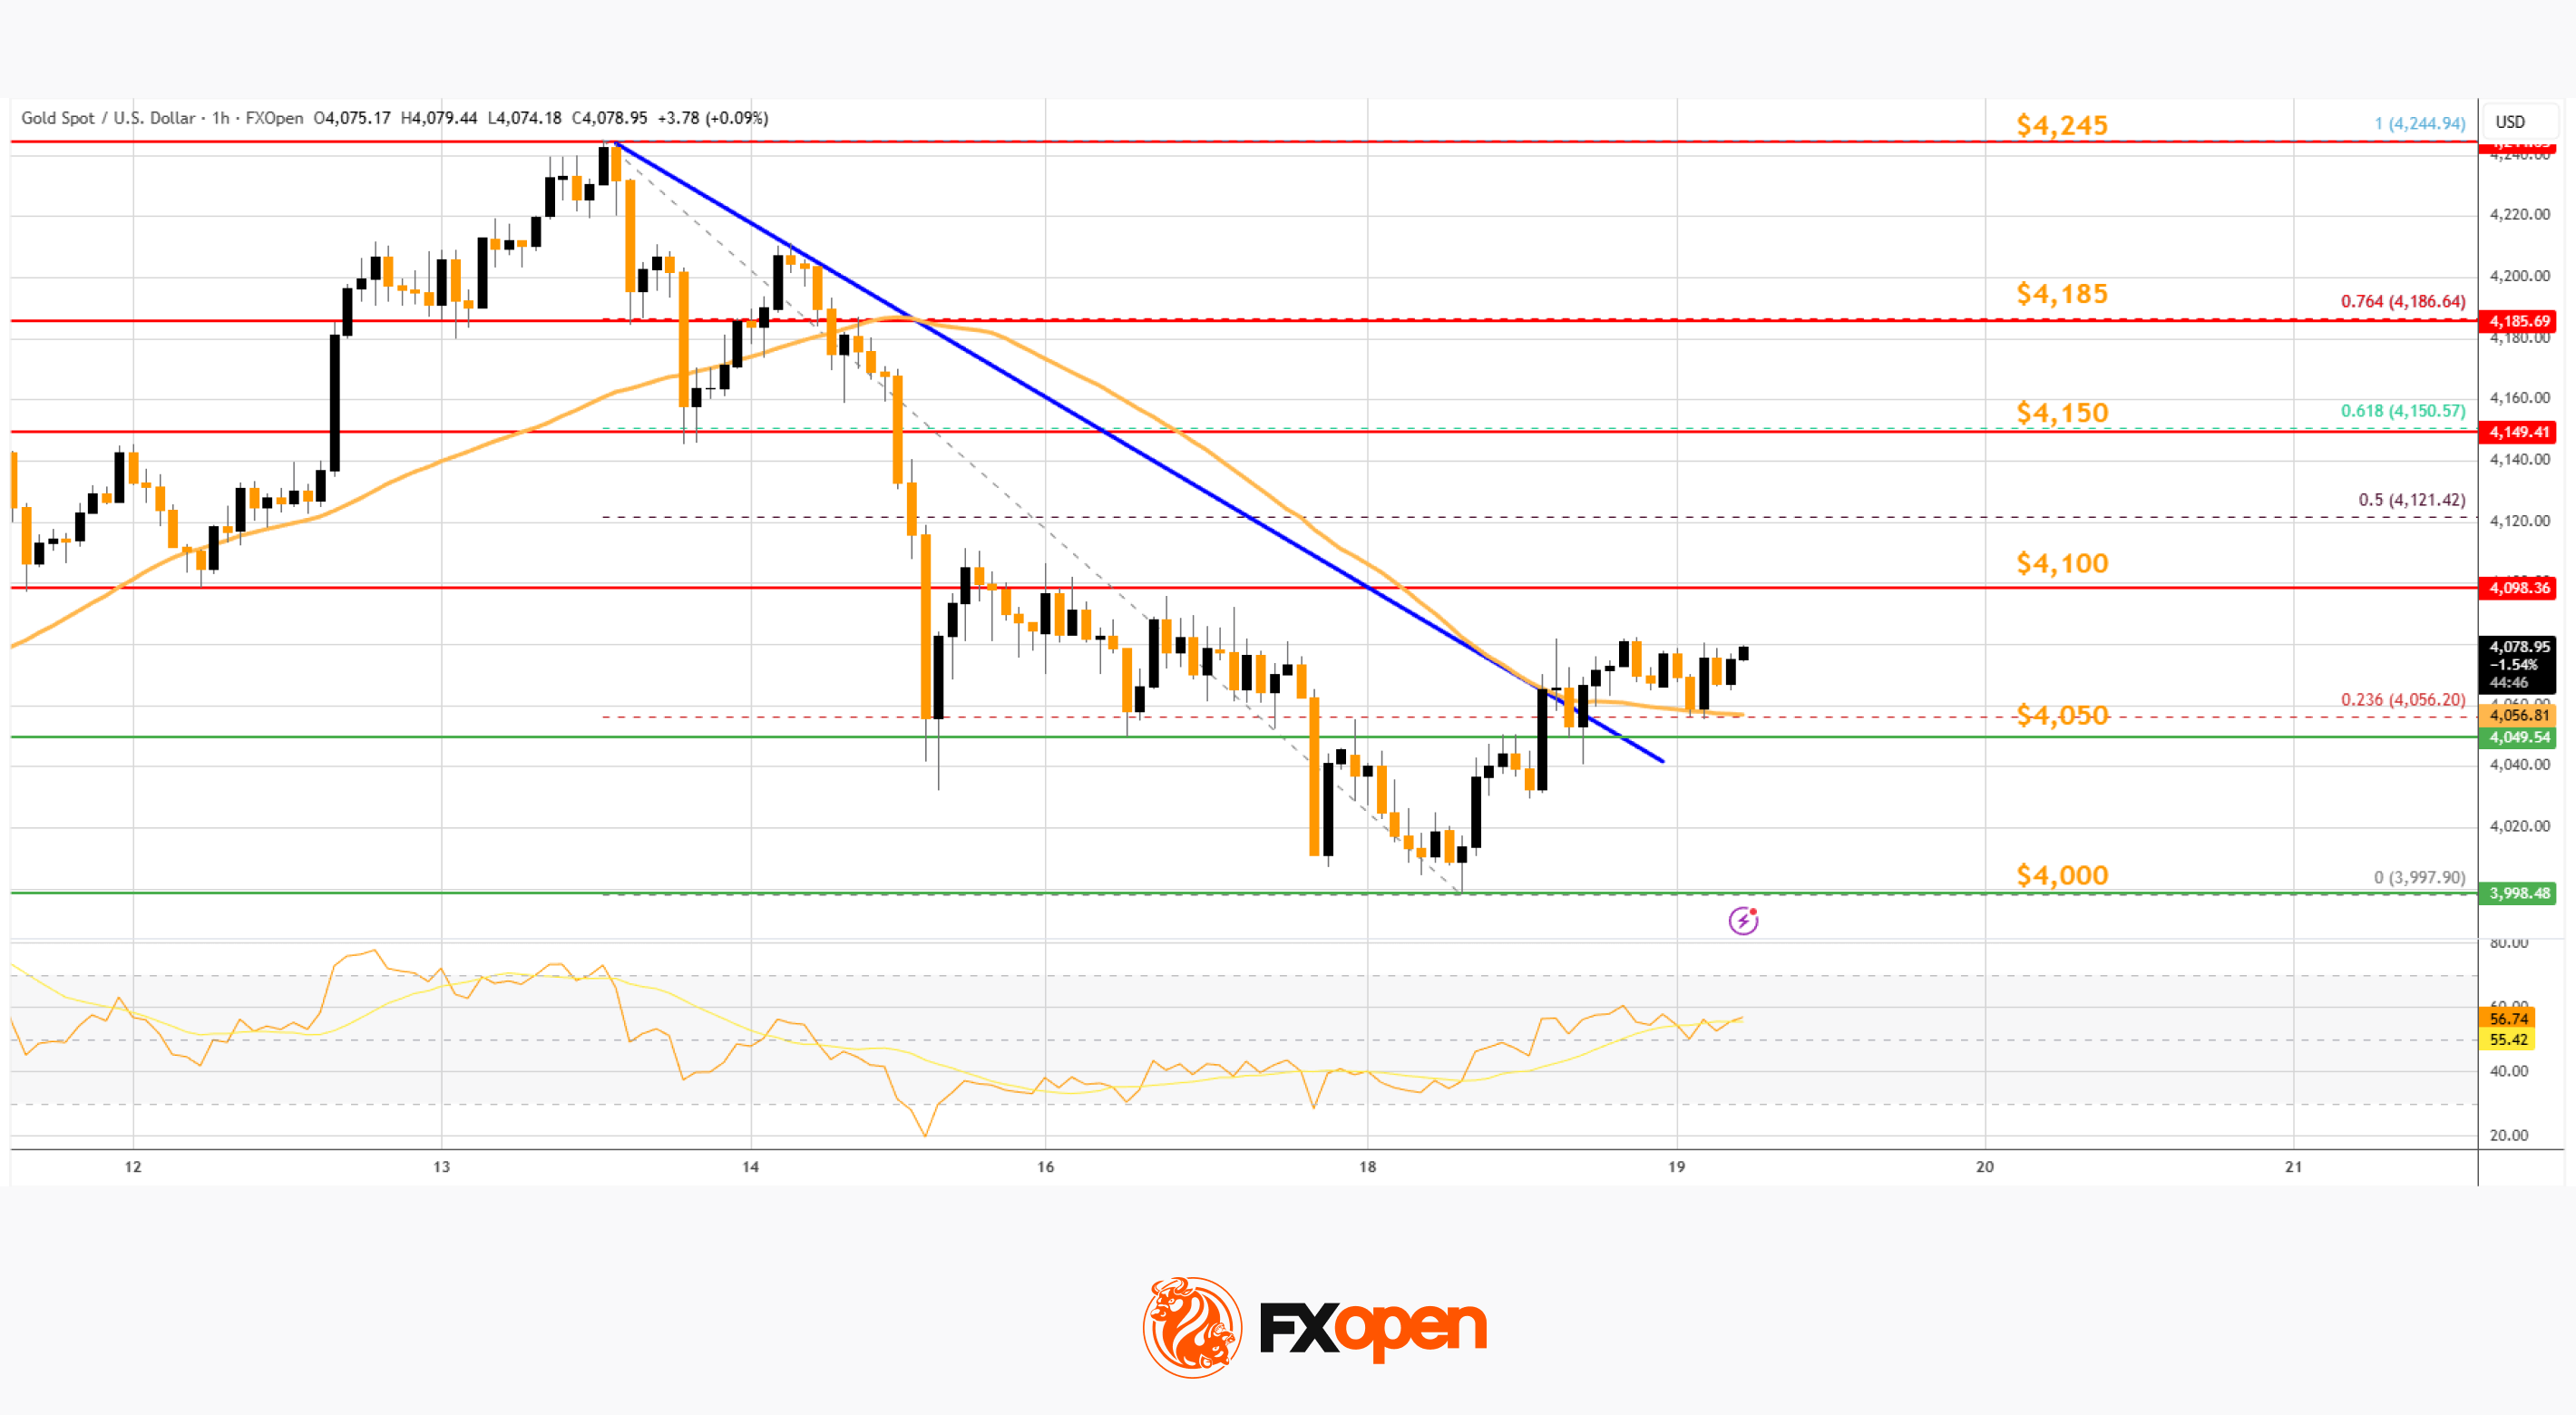
There was a break above a key bearish trend line with resistance at $4,050. The price climbed above the 23.6% Fib retracement level of the downward move from the $4,244 swing high to the $3,997 low.
Immediate resistance on the upside is $4,100. The first major hurdle sits at $4,150 and the 61.8% Fib retracement. A close above $4,150 could initiate a recovery wave to $4,185. An upside break above $4,185 could send Gold price toward $4,250. Any more gains may perhaps set the pace for an increase toward $4,320.
If there is no recovery wave, the price could continue to move down. Initial support on the downside is near the $4,050 level. The first key area of interest might be $4,000. If there is a downside break below $4,000, the price might decline further. In the stated case, the price might drop to $3,880.
WTI Crude Oil Price Technical Analysis
On the hourly chart of WTI Crude Oil at FXOpen, the price started a decent increase from $58.00 against the US Dollar. The price gained bullish momentum after it broke $59.00.
There was a sustained upward movement above $59.50 and $60.00. The bulls pushed the price above the 50-hour simple moving average, and the RSI climbed toward 70. A high was formed near $60.75 before there was a minor pullback.
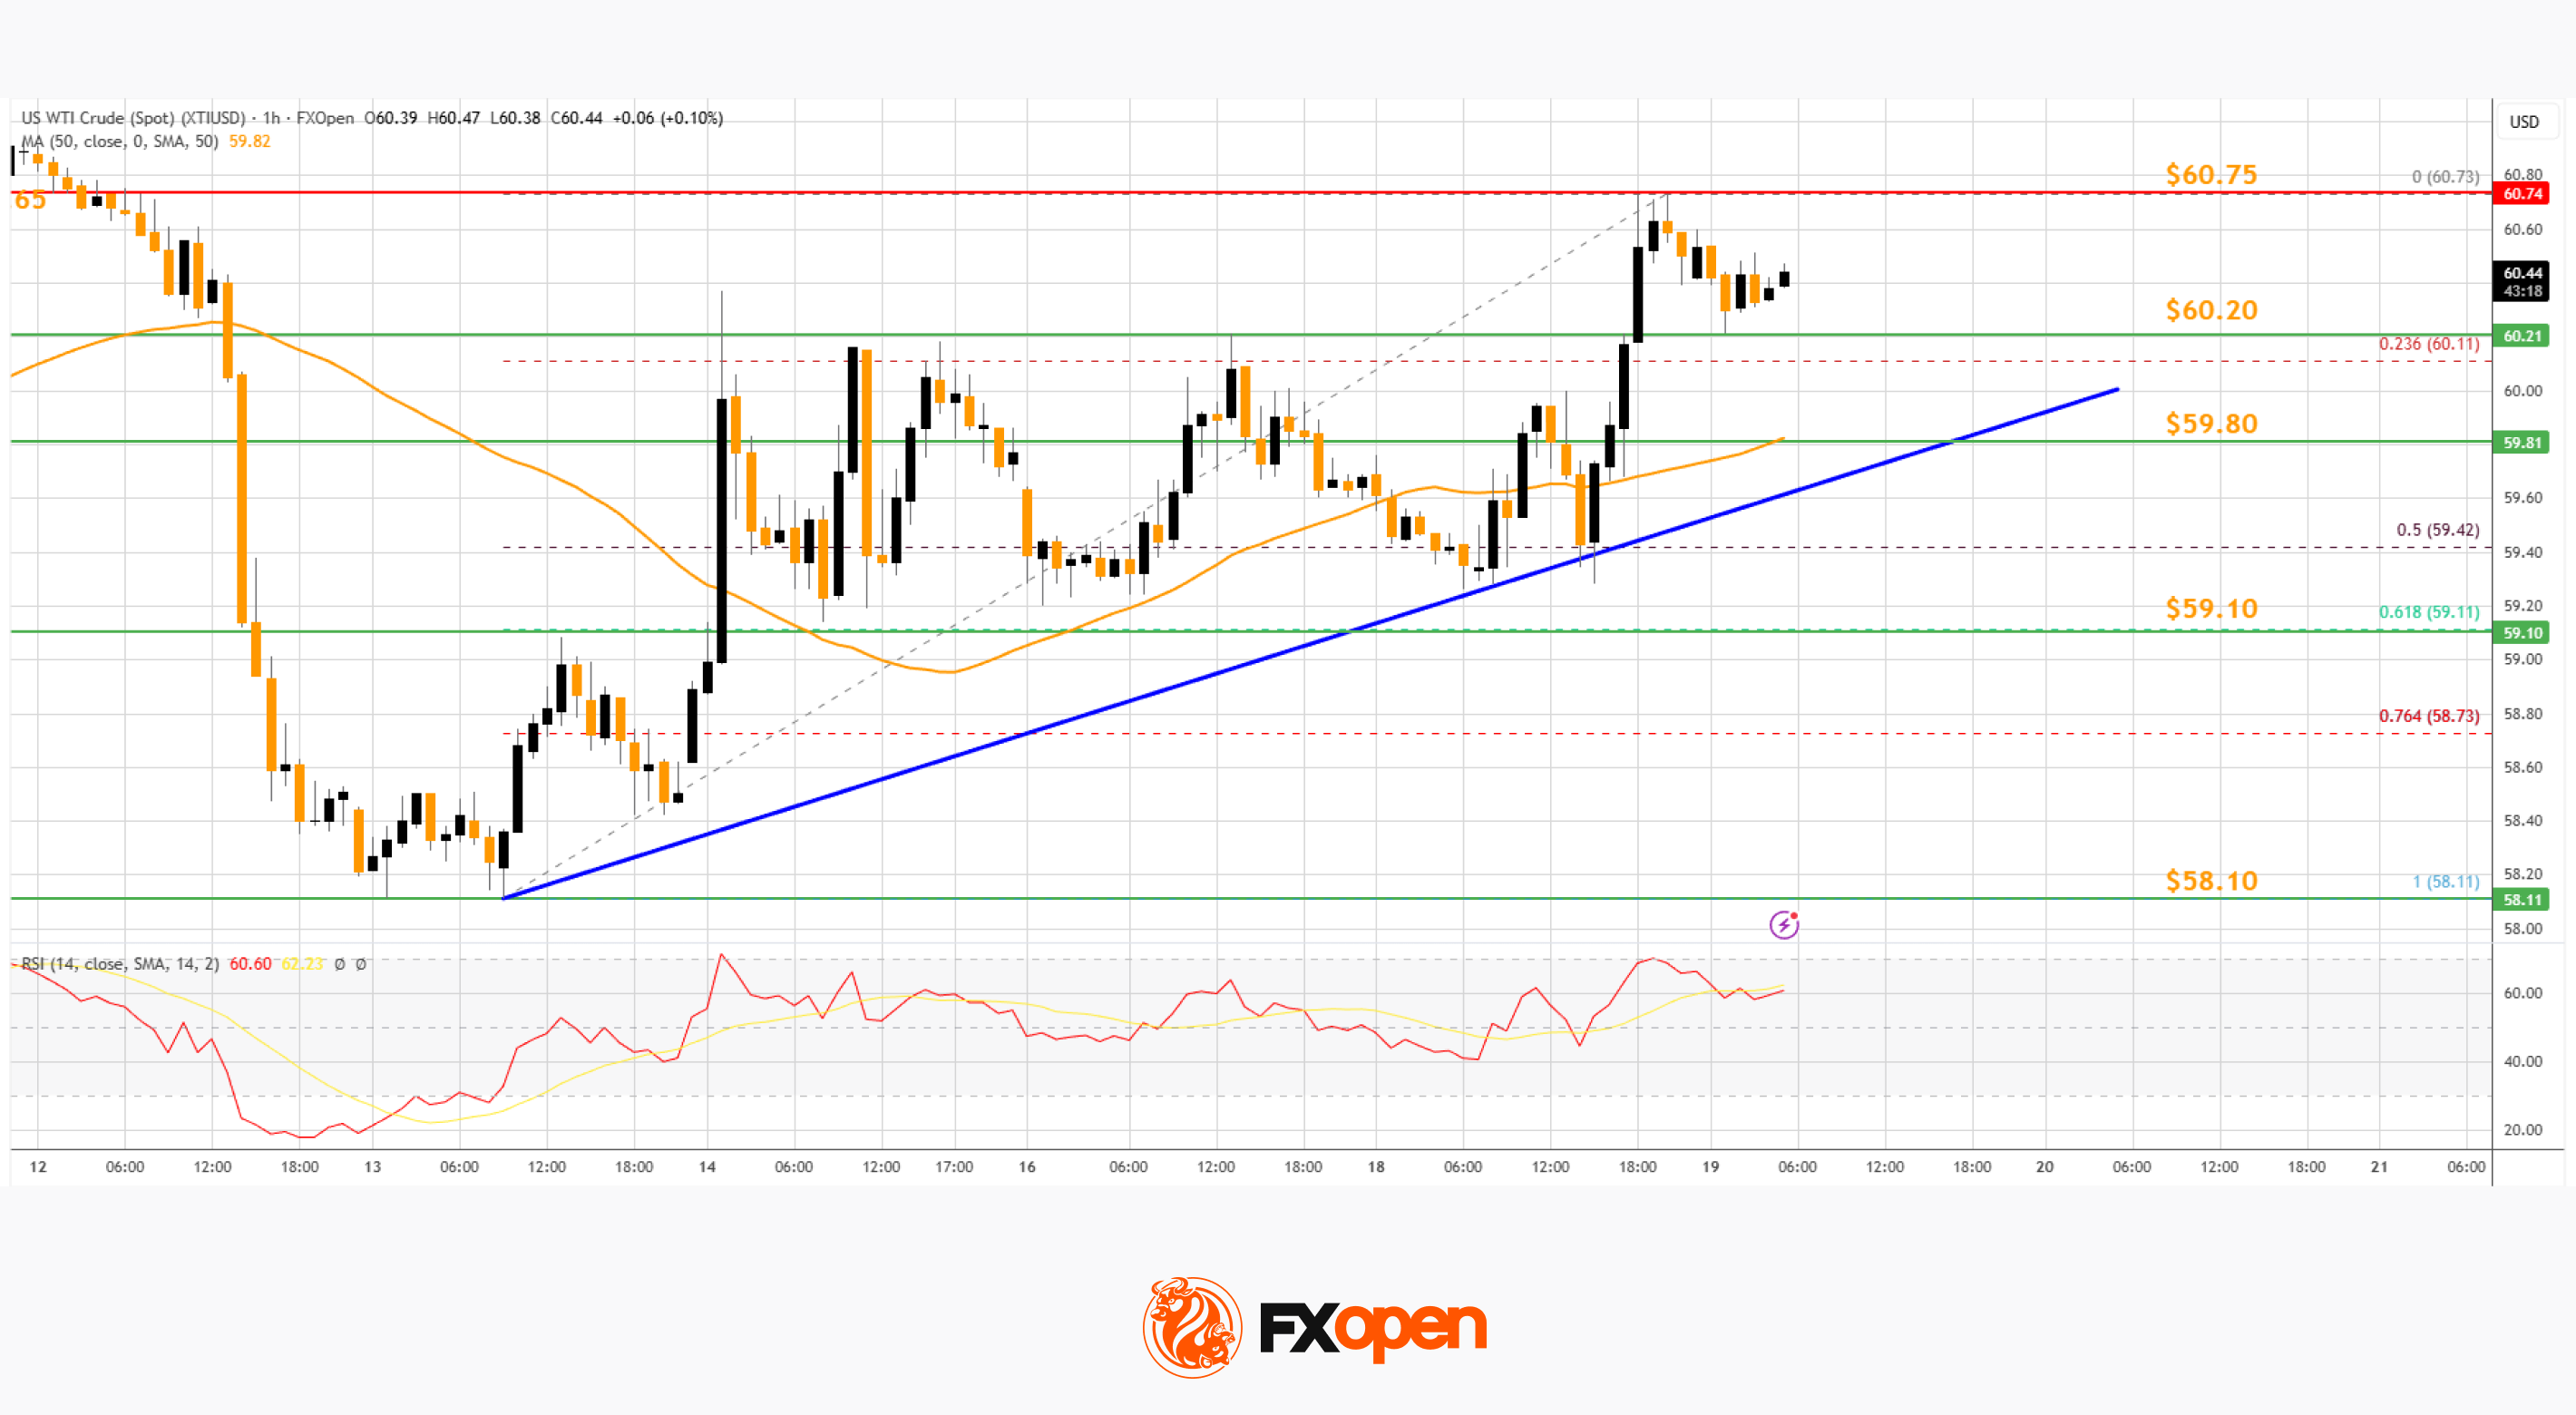
The price declined toward the 23.6% Fib retracement level of the upward move from the $58.11 swing low to the $60.75 high. However, the bulls are active above $60.00. There is also a key bullish trend line forming with support near $59.80.
Immediate resistance is near $60.75 level. If the price climbs further, it could face hurdles near $61.50. The next major stop for the bulls might be $62.20. Any more gain might send the price toward $63.50.
Conversely, the price might correct gains and retest the 50-hour simple moving average or the trend line. The next area of interest on the WTI crude oil chart is near the 61.8% Fib retracement at $59.10. If there is a downside break, the price might decline to $58.10. Any more losses may perhaps open the doors for a move toward $56.50.
Start trading commodity CFDs with tight spreads (additional fees may apply). Open your trading account now or learn more about trading commodity CFDs with FXOpen.
This article represents the opinion of the Companies operating under the FXOpen brand only. It is not to be construed as an offer, solicitation, or recommendation with respect to products and services provided by the Companies operating under the FXOpen brand, nor is it to be considered financial advice.
Stay ahead of the market!
Subscribe now to our mailing list and receive the latest market news and insights delivered directly to your inbox.


Latest articles

Consolidation Ahead of NFP: Commodity Currencies Search for Direction
Commodity-linked currencies have entered a consolidation phase following recent directional moves, as market participants adopt a wait-and-see approach ahead of key US labour market data. Current price action reflects a balance between ongoing demand for the US dollar and attempts

The Real Driver Behind the Dollar Rally: Market Insights with Gary Thomson
The US dollar has been firm, but the drivers behind the move may be more complex than they first appear.
While geopolitical tension and shifts in risk sentiment play a role, current price behaviour seems increasingly influenced by inflation expectations

EUR/USD and USD/CHF Pull Back: Market Reacts to Fundamentals
European currencies have shown a recovery in recent trading sessions after their recent decline, displaying early signs of a reversal. The US dollar is weakening amid expectations surrounding upcoming US macroeconomic data, while market participants are reassessing their short-term positions