


FXOpen

Gold price rallied further and traded to a new all-time high. Crude oil is showing bearish signs and might decline below $70.00.
Important Takeaways for Gold and WTI Crude Oil Prices Analysis Today
· Gold price started a steady increase above the $2,880 zone against the US Dollar.
· A major bullish trend line is forming with support at $2,885 on the hourly chart of gold at FXOpen.
· WTI Crude oil prices failed to clear the $73.50 region and started a fresh decline.
· There is a key bearish trend line forming with resistance at $71.00 on the hourly chart of XTI/USD at FXOpen.
Gold Price Technical Analysis
On the hourly chart of Gold at FXOpen, the price found support near the $2,855 zone. The price remained in a bullish zone and started a strong increase above $2,900.
There was a decent move above the 50-hour simple moving average and $2,920. The bulls pushed the price above the $2,930 and $2,935 resistance levels. Finally, the price climbed as high as $2,940 before there was a pullback.
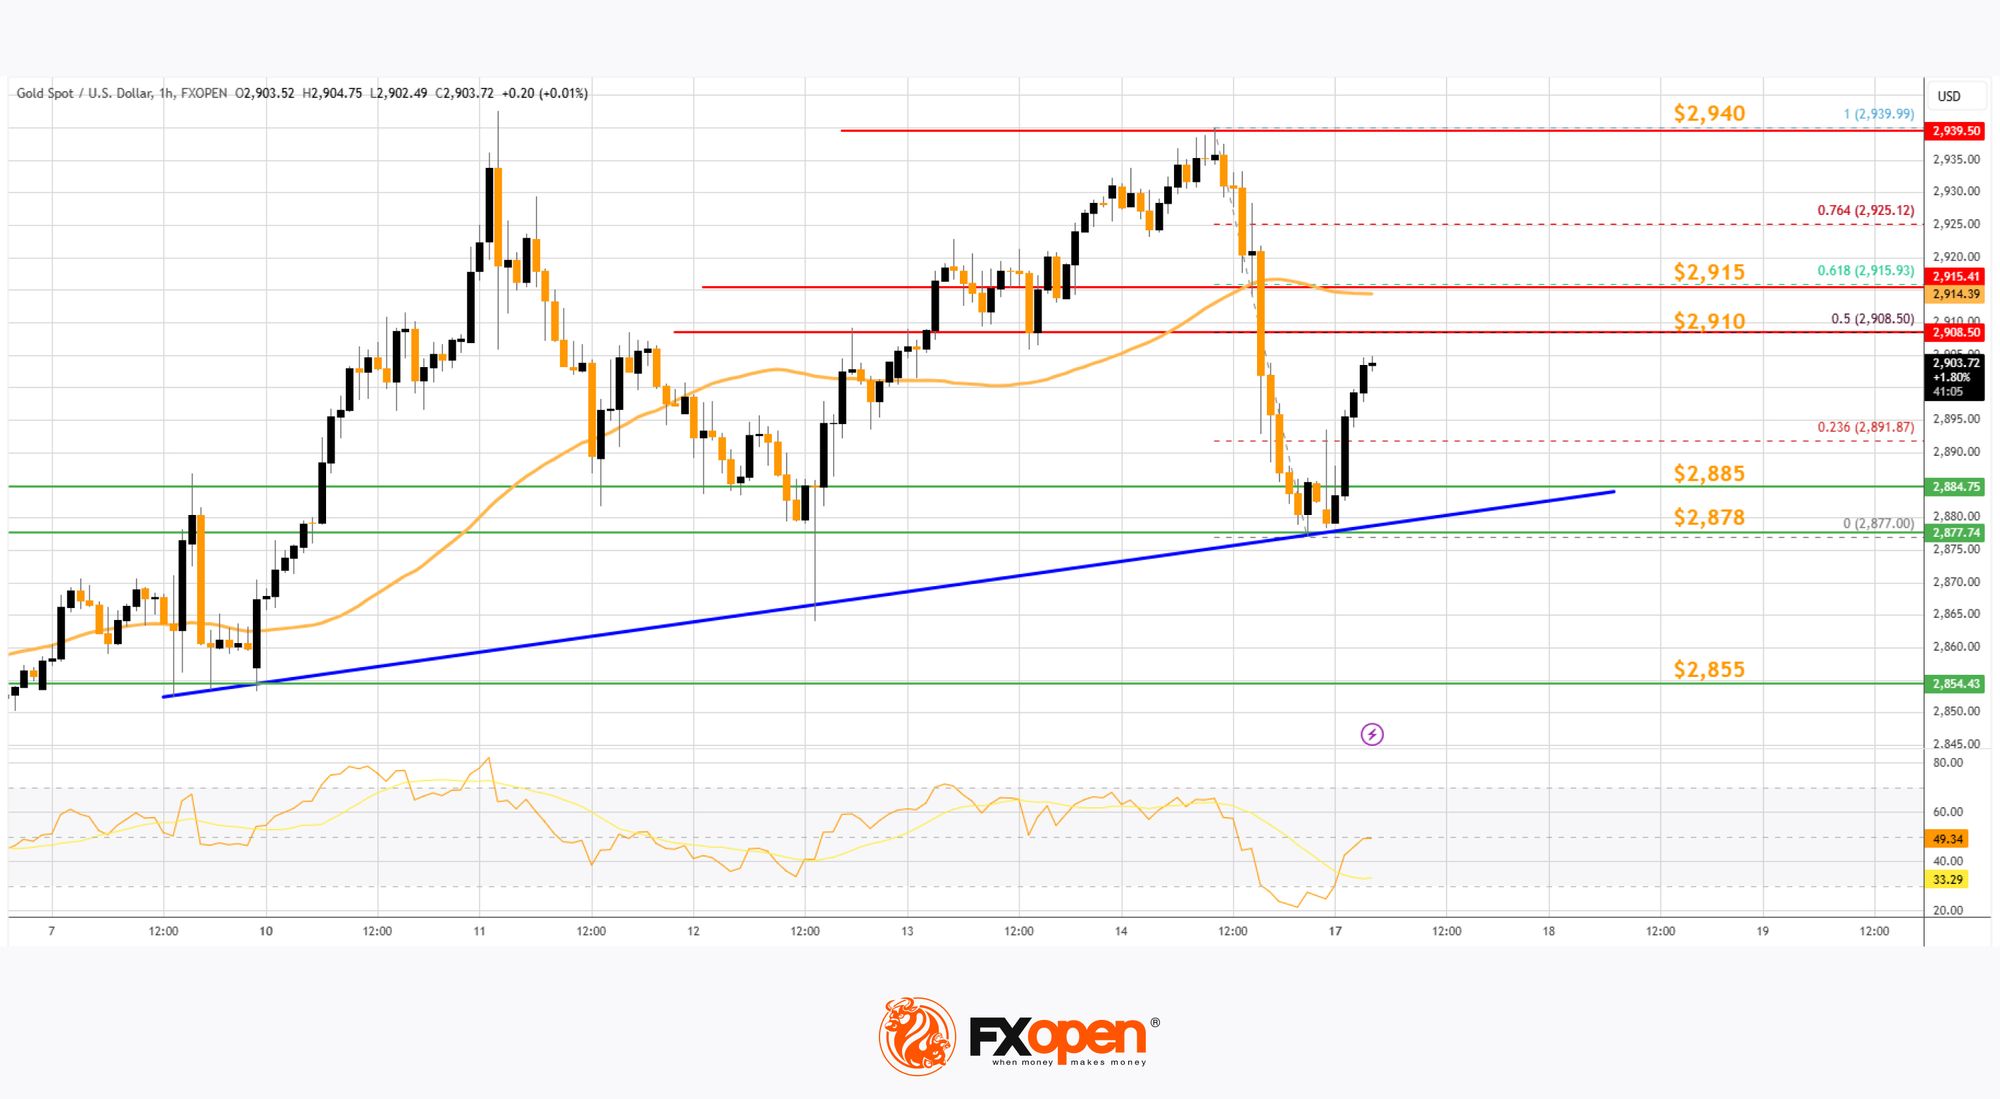
The price tested the $2,880 zone and is currently rising. There was a move above the 23.6% Fib retracement level of the downside correction from the $2,940 swing high to the $2,878 low, and the RSI is stable above 45.
Immediate resistance is near the $2,910 level and the 50% Fib retracement level of the downside correction from the $2,940 swing high to the $2,878 low.
The next major resistance is near the $2,915 level. An upside break above the $2,915 resistance could send Gold price toward $2,940. Any more gains may perhaps set the pace for an increase toward the $2,950 level.
Initial support on the downside is near a major bullish trend line at $2,885. The first major support is near the $2,878 zone. If there is a downside break below the $2,878 support, the price might decline further.
In the stated case, the price might drop toward the $2,855 zone. Any more losses might push the price toward the $2,840 level.
WTI Crude Oil Price Technical Analysis
On the hourly chart of WTI Crude Oil at FXOpen, the price struggled to clear the $73.50 resistance zone against the US Dollar. The price started a fresh decline below the $72.20 support.
The price even dipped below the $71.50 level and the 50-hour simple moving average. The bulls are now active near the $70.20 level. A low was formed at $70.12, and the price is now consolidating losses. If there is a fresh increase, it could face resistance near the 50% Fib retracement level of the downward move from the $71.87 swing high to the $70.12 low at $71.00.
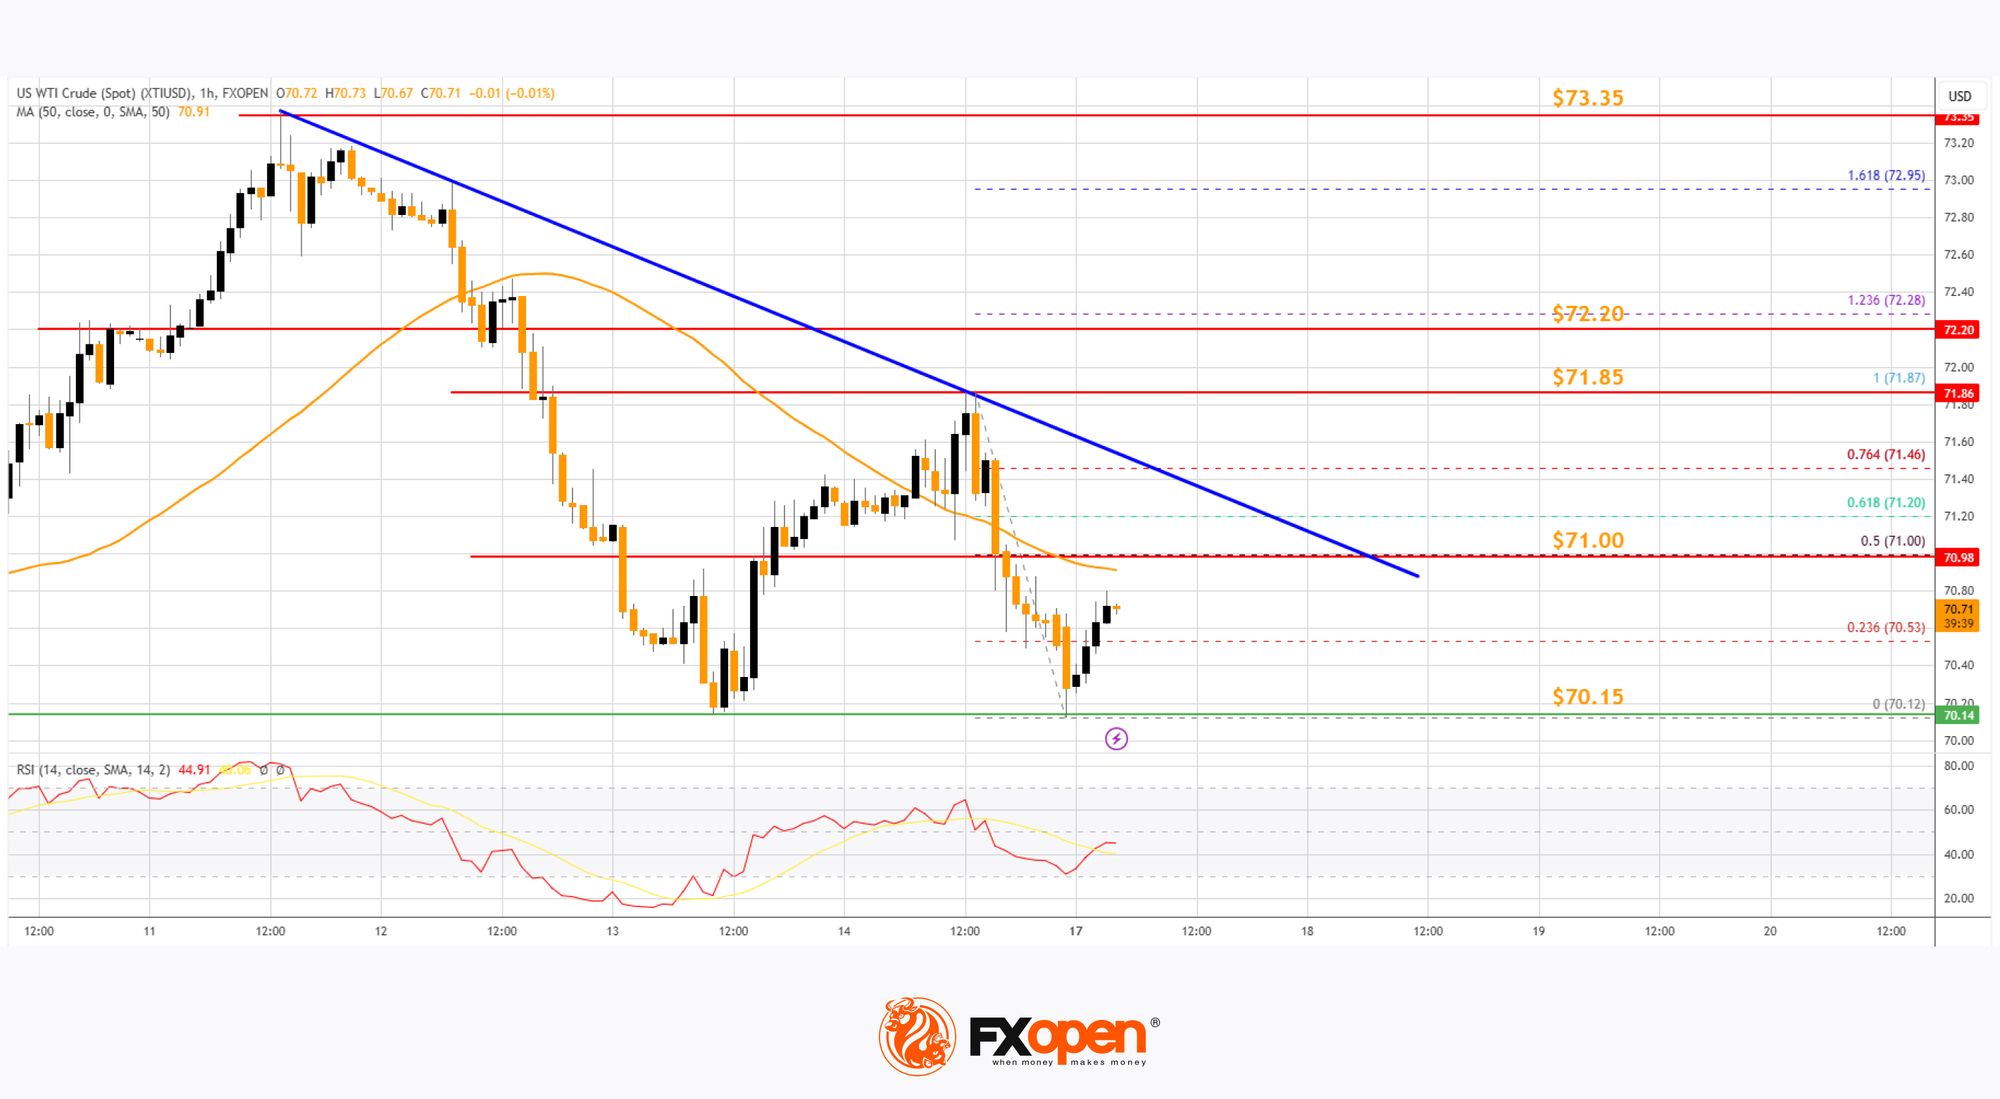
There is also a key bearish trend line forming with resistance at $71.00. The first major resistance is near the $71.85 level. Any more gains might send the price toward the $72.20 level.
The main resistance could be near the $73.35 level. Conversely, the price might continue to move down and revisit the $70.00 support. The next major support on the WTI crude oil chart is $68.80.
If there is a downside break, the price might decline toward $66.50. Any more losses may perhaps open the doors for a move toward the $65.00 support zone.
Start trading commodity CFDs with tight spreads (additional fees may apply). Open your trading account now or learn more about trading commodity CFDs with FXOpen.
This article represents the opinion of the Companies operating under the FXOpen brand only. It is not to be construed as an offer, solicitation, or recommendation with respect to products and services provided by the Companies operating under the FXOpen brand, nor is it to be considered financial advice.
Stay ahead of the market!
Subscribe now to our mailing list and receive the latest market news and insights delivered directly to your inbox.


Latest articles

EUR/USD and USD/CHF Pull Back: Market Reacts to Fundamentals
European currencies have shown a recovery in recent trading sessions after their recent decline, displaying early signs of a reversal. The US dollar is weakening amid expectations surrounding upcoming US macroeconomic data, while market participants are reassessing their short-term positions

Weak Data Weigh on the Dollar: Market Awaits Trend Confirmation
The US dollar is retreating from recent highs, moving into a moderate correction after a prolonged period of gains. Pressure on the currency is building amid weaker-than-expected macroeconomic data, while market participants adopt a wait-and-see approach ahead of key labour

Market Analysis: EUR/USD Aims Recovery While USD/JPY Gives Back Recent Gains
EUR/USD is recovering losses from 1.1450. USD/JPY is correcting gains from 160.50 and might decline further below 158.00.
Important Takeaways for EUR/USD and USD/JPY Analysis Today
· The Euro struggled to stay in a