


Technical Analysis on April 17, 2023: GBP/USD Corrects Gains While USD/CAD Eyes Recovery
FXOpen
GBP/USD faced resistance near 1.2540 and started a downside correction. USD/CAD is recovering and might gain pace if it clears the 1.3370 resistance.
Important Takeaways for GBP/USD and USD/CAD
· The British Pound started a downside correction below the 1.2500 zone.
· There was a break below a key bullish trend line with support at 1.2455 on the hourly chart of GBP/USD at FXOpen.
· USD/CAD declined below the 1.3450 and 1.3400 support levels.
· A major bearish trend line is forming with resistance near 1.3370 on the hourly chart at FXOpen.
GBP/USD Technical Analysis
On the hourly chart of GBP/USD at FXOpen, the pair was able to climb above the 1.2455 resistance zone. However, the bears were active near the 1.2540 zone.
As a result, the pair started a downside correction below a key bullish trend line with support at 1.2455. Finally, it spiked below the 1.2400 support. A low is formed near 1.2383 and the pair is now consolidating losses.
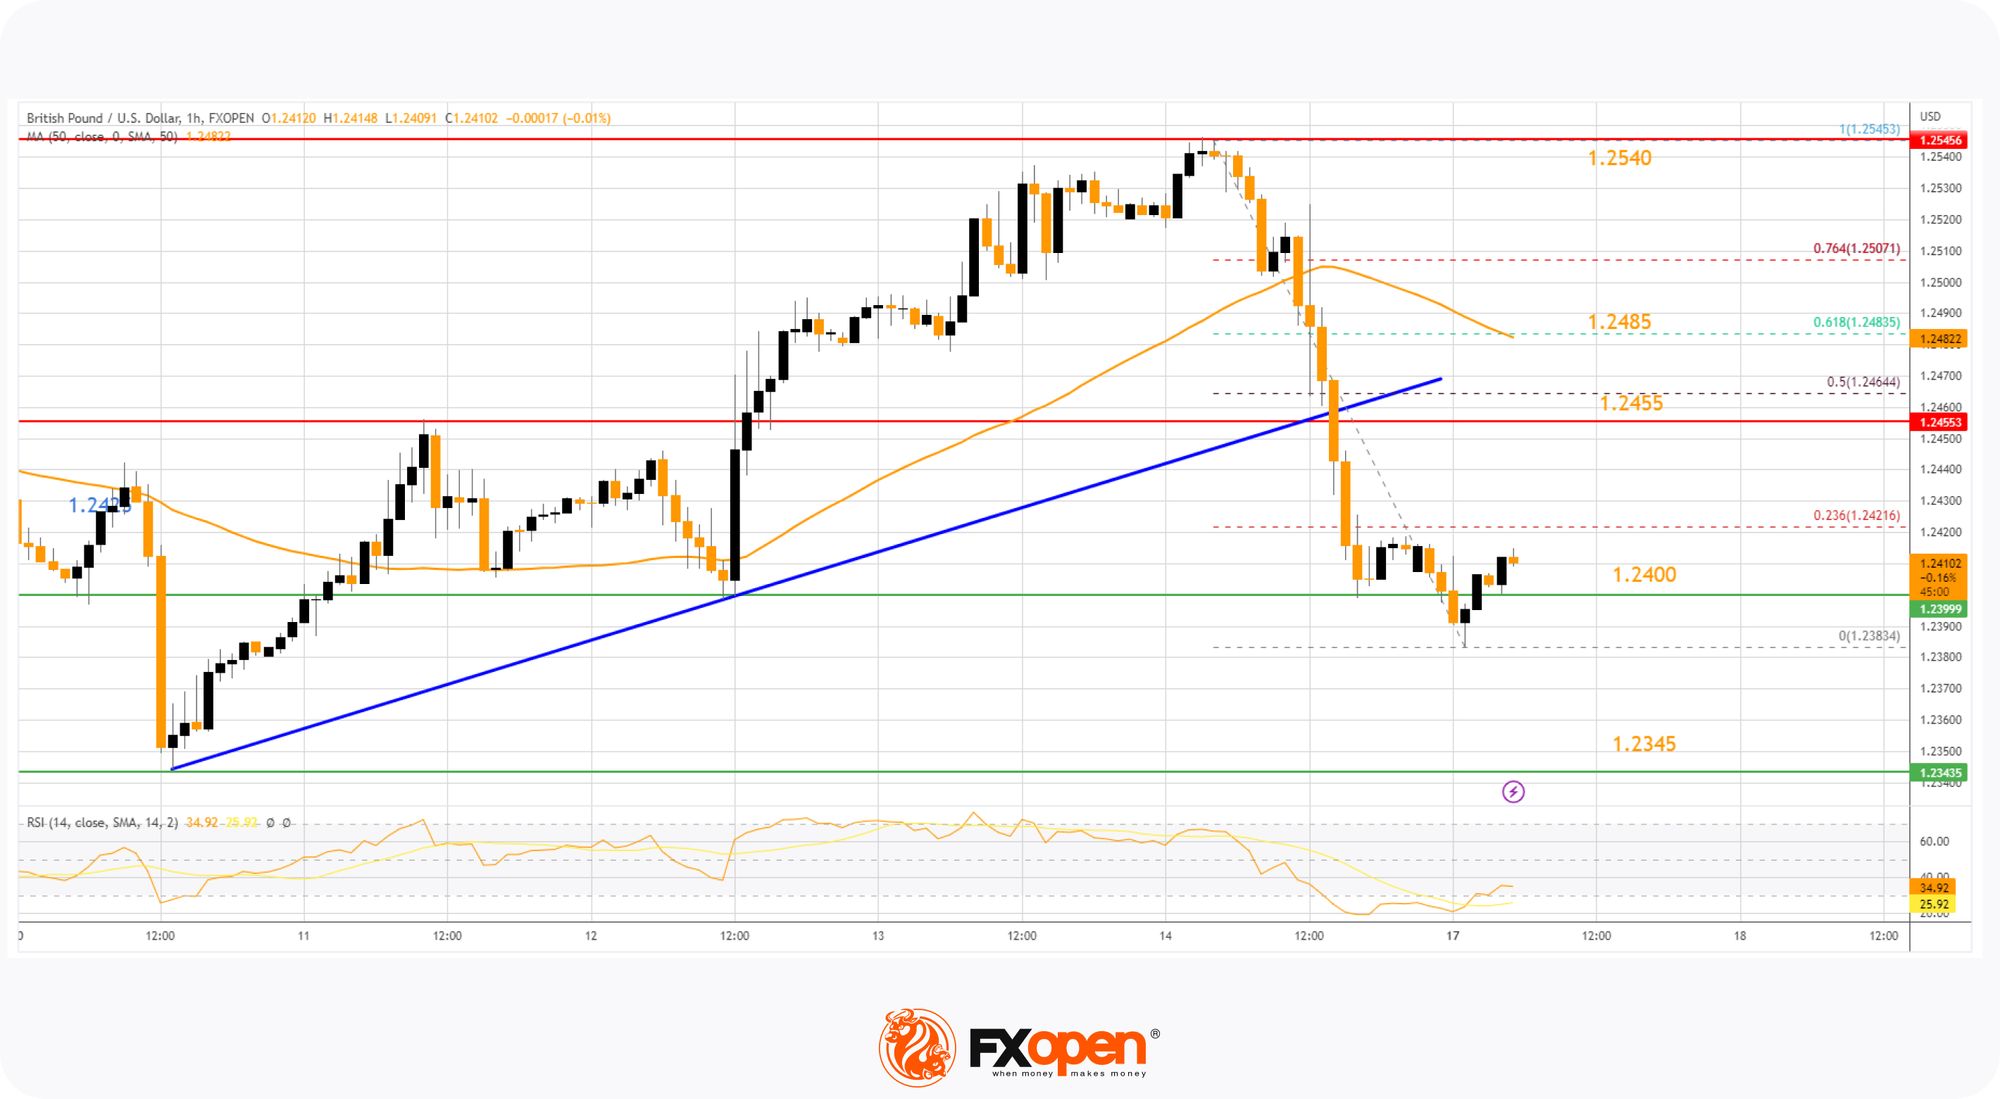
Immediate resistance is forming near the 23.6% Fib retracement level of the downward move from the 1.2545 swing high to the 1.2383 low at 1.2425.
The next resistance is near 1.2455 (the recent breakdown zone). With an upside break above the 1.2455 zone, the pair could rise toward the 50-hour simple moving average at 1.2485. It coincides with the 61.8% Fib retracement level of the downward move from the 1.2545 swing high to the 1.2383 low.
An upside break above the 1.2485 resistance might send the pair toward 1.2540. Any more gains might open the doors for a test of 1.2600.
On the downside, initial support is near the 1.2400 area. The next major support is near the 1.2345 level. If there is a break below 1.2345, the pair could extend its decline. The next key support is near the 1.2300 level. Any more losses might call for a test of the 1.2250 support.
USD/CAD Technical Analysis
On the hourly chart of USD/CAD at FXOpen, the pair started a fresh decline from the 1.3550 resistance zone. The US Dollar gained bearish momentum below the 1.3425 support against the Canadian Dollar.
Finally, it spiked below the 1.3315 support and traded as low as 1.3300. Recently, there was a recovery wave above the 1.3315 level. The pair climbed above the 23.6% Fib retracement level of the downward move from the 1.3553 swing high to the 1.3300 low.
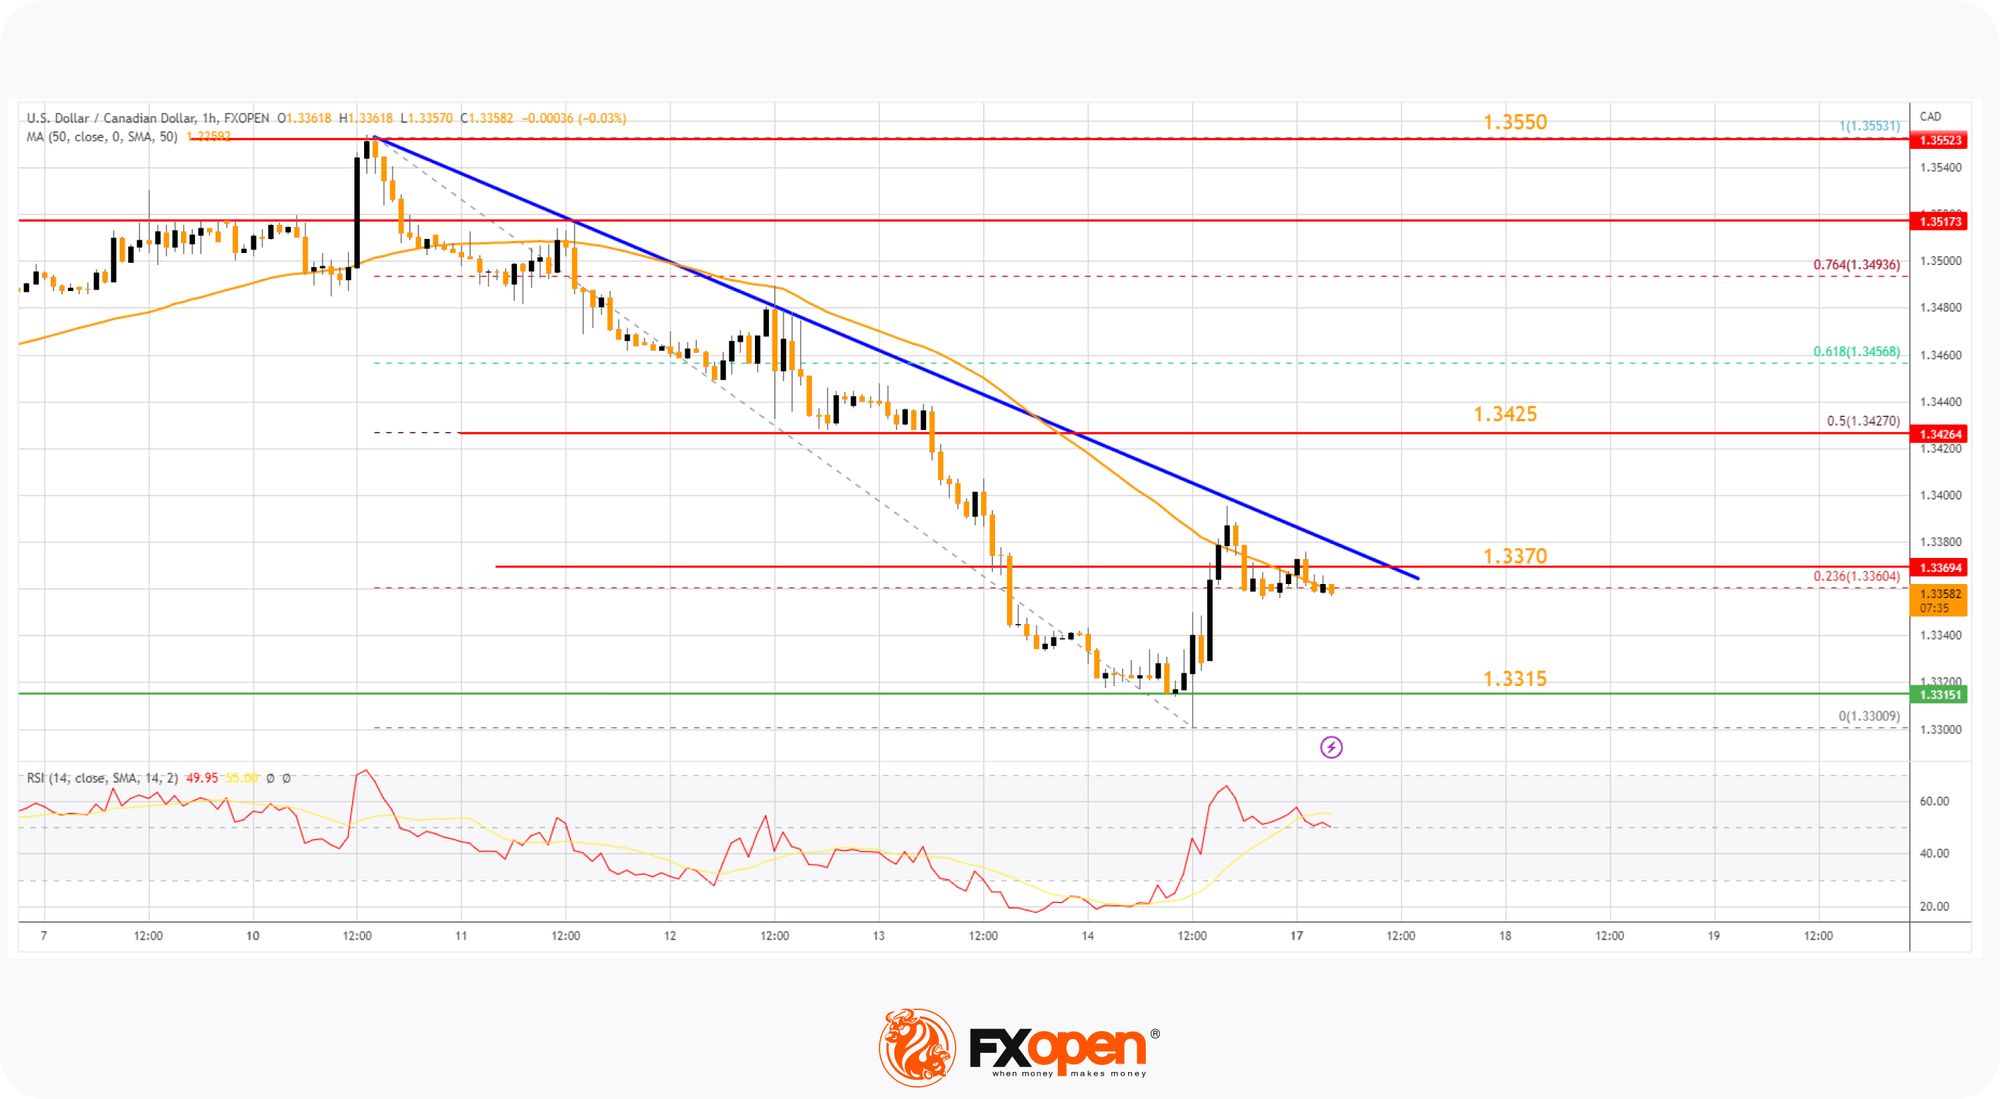
It is now facing resistance near a major bearish trend line and the 50-hour simple moving average at 1.3370. If there is an upside break above the trend line, the pair could rise toward the 50% Fib retracement level of the downward move from the 1.3553 swing high to the 1.3300 low at 1.3425.
A clear break above the 1.3425 level could open the doors for more gains. The next major resistance is near the 1.3550 level, above which USD/CAD could rise steadily toward the 1.3600 resistance zone.
Immediate support is near the 1.3315 level. A close below the 1.3315 level might trigger a strong decline. In the stated case, USD/CAD might test 1.3200. Any more losses may possibly open the doors for a drop toward the 1.3120 support.
This forecast represents FXOpen Companies’ opinion only, it should not be construed as an offer, invitation, or recommendation with respect to FXOpen Companies’ products and services or as financial advice.
Trade over 50 forex markets 24 hours a day with FXOpen. Take advantage of low commissions, deep liquidity, and spreads from 0.0 pips (additional fees may apply). Open your FXOpen account now or learn more about trading forex with FXOpen.
This article represents the opinion of the Companies operating under the FXOpen brand only. It is not to be construed as an offer, solicitation, or recommendation with respect to products and services provided by the Companies operating under the FXOpen brand, nor is it to be considered financial advice.
Stay ahead of the market!
Subscribe now to our mailing list and receive the latest market news and insights delivered directly to your inbox.


Latest articles

Weekly Market Insights with Gary Thomson: The Week of Central Banks and Earnings
In this video, we’ll explore the key economic events and market trends, shaping the financial landscape. Get ready for insights into financial markets to help you navigate the week ahead. Let’s dive in!
In this episode of Market

Intel at a Crossroads: Earnings Beat Meets Technical Resistance
Intel has just delivered its strongest quarter in over fifteen years, and the market reaction says it all. Q2 2026 revenue surged 25% year-over-year to $16.1 billion, crushing the consensus estimate of $14.42 billion, while adjusted EPS of

Tesla: Complex Range Structure Breaks Down Following Quarterly Earnings
Tesla released its Q2 2026 results after the market closed on 22 July. Revenue increased 26% year-on-year to $28.24 billion, while vehicle deliveries reached a record 480,126 units. However, operating margin fell sharply to 1.4%, down from