


EUR/USD Dives While USD/CHF Extends Rally
FXOpen

EUR/USD started a fresh decline below the 1.0695 support. USD/CHF is rising and might aim a move toward the 0.9250 resistance.
Important Takeaways for EUR/USD and USD/CHF Analysis Today
· The Euro struggled to clear the 1.0750 resistance and declined against the US Dollar.
· There was a break below a key bullish trend line with support at 1.0695 on the hourly chart of EUR/USD at FXOpen.
· USD/CHF is showing positive signs above the 0.9185 resistance zone.
· There was a break above a major bearish trend line with resistance at 0.9130 on the hourly chart at FXOpen.
EUR/USD Technical Analysis
On the hourly chart of EUR/USD at FXOpen, the pair failed to clear the 1.0750 resistance. The Euro started a fresh decline below the 1.0700 support against the US Dollar, as mentioned in the previous analysis.
There was a break below a key bullish trend line with support at 1.0695. Besides, the pair declined below the 50-hour simple moving average and 1.0675. The pair traded as low as 1.0654 and is currently correcting losses.
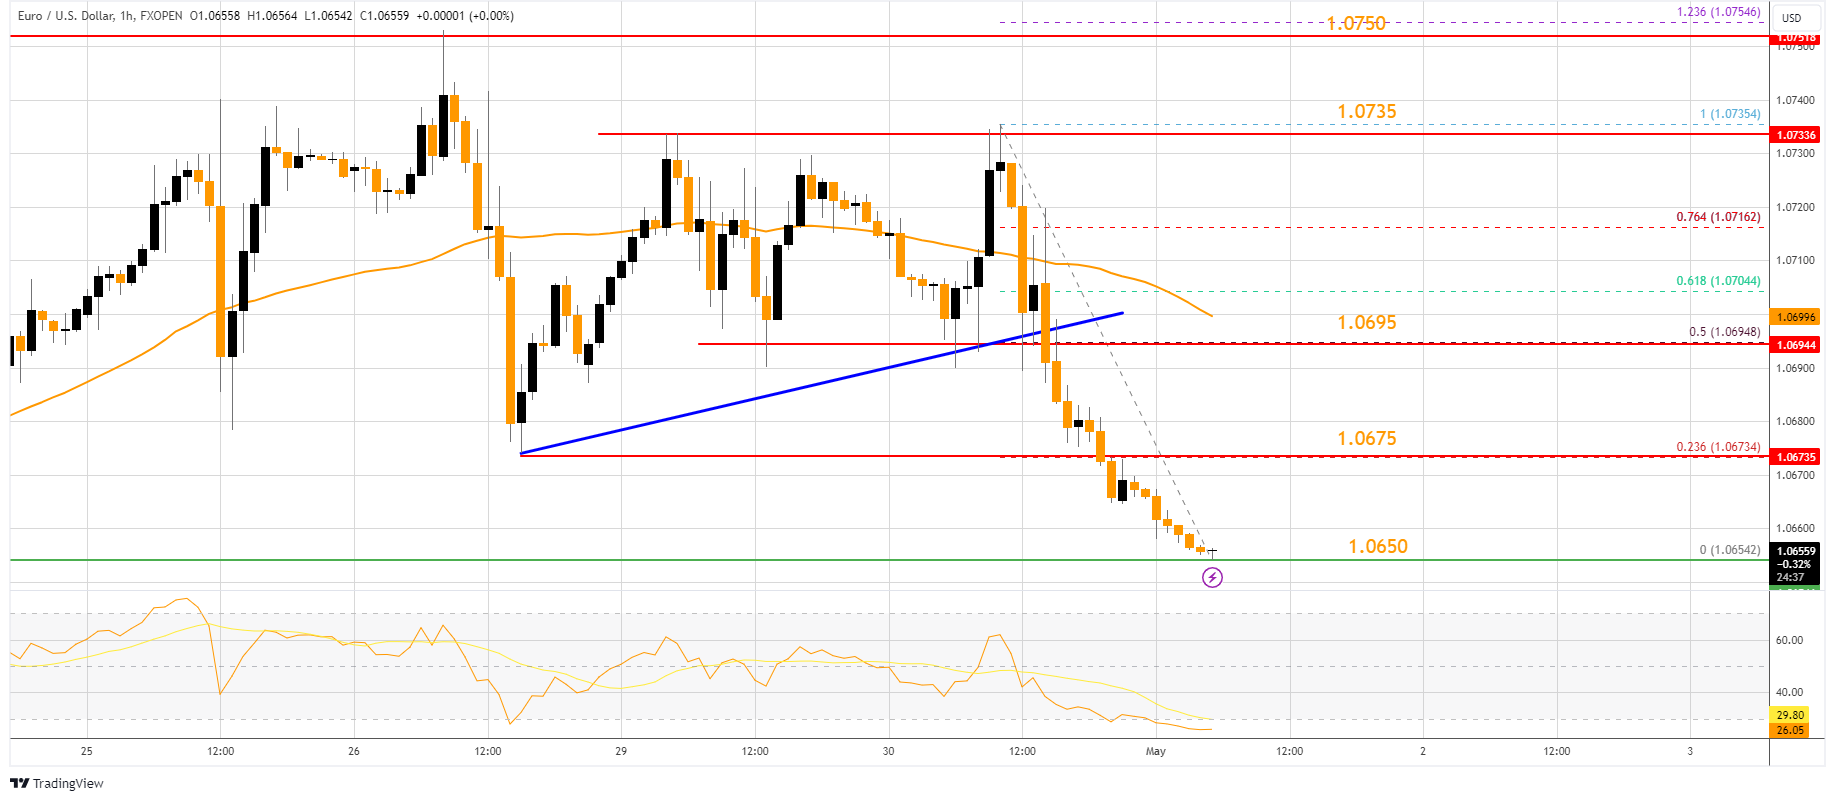
The pair is showing bearish signs, and the upsides might remain capped. Immediate resistance on the upside is near the 23.6% Fib retracement level of the downward move from the 1.0735 swing high to the 1.0654 low at 1.0675.
The next major resistance is near the 1.0695 zone or the 50-hour simple moving average. It is close to the 50% Fib retracement level of the downward move from the 1.0735 swing high to the 1.0654 low.
An upside break above the 1.0695 level might send the pair toward the 1.0735 resistance. Any more gains might open the doors for a move toward the 1.0750 level.
On the downside, immediate support on the EUR/USD chart is seen near 1.0650. The next major support is near the 1.0630 level. A downside break below the 1.0630 support could send the pair toward the 1.0580 level.
USD/CHF Technical Analysis
On the hourly chart of USD/CHF at FXOpen, the pair started a decent increase from the 0.9100 support. The US Dollar climbed above the 0.9120 resistance zone against the Swiss Franc.
There was a break above a major bearish trend line with resistance at 0.9130. The bulls were able to pump the pair above the 50-hour simple moving average and 0.9185. Finally, the pair tested the 0.9215 zone.
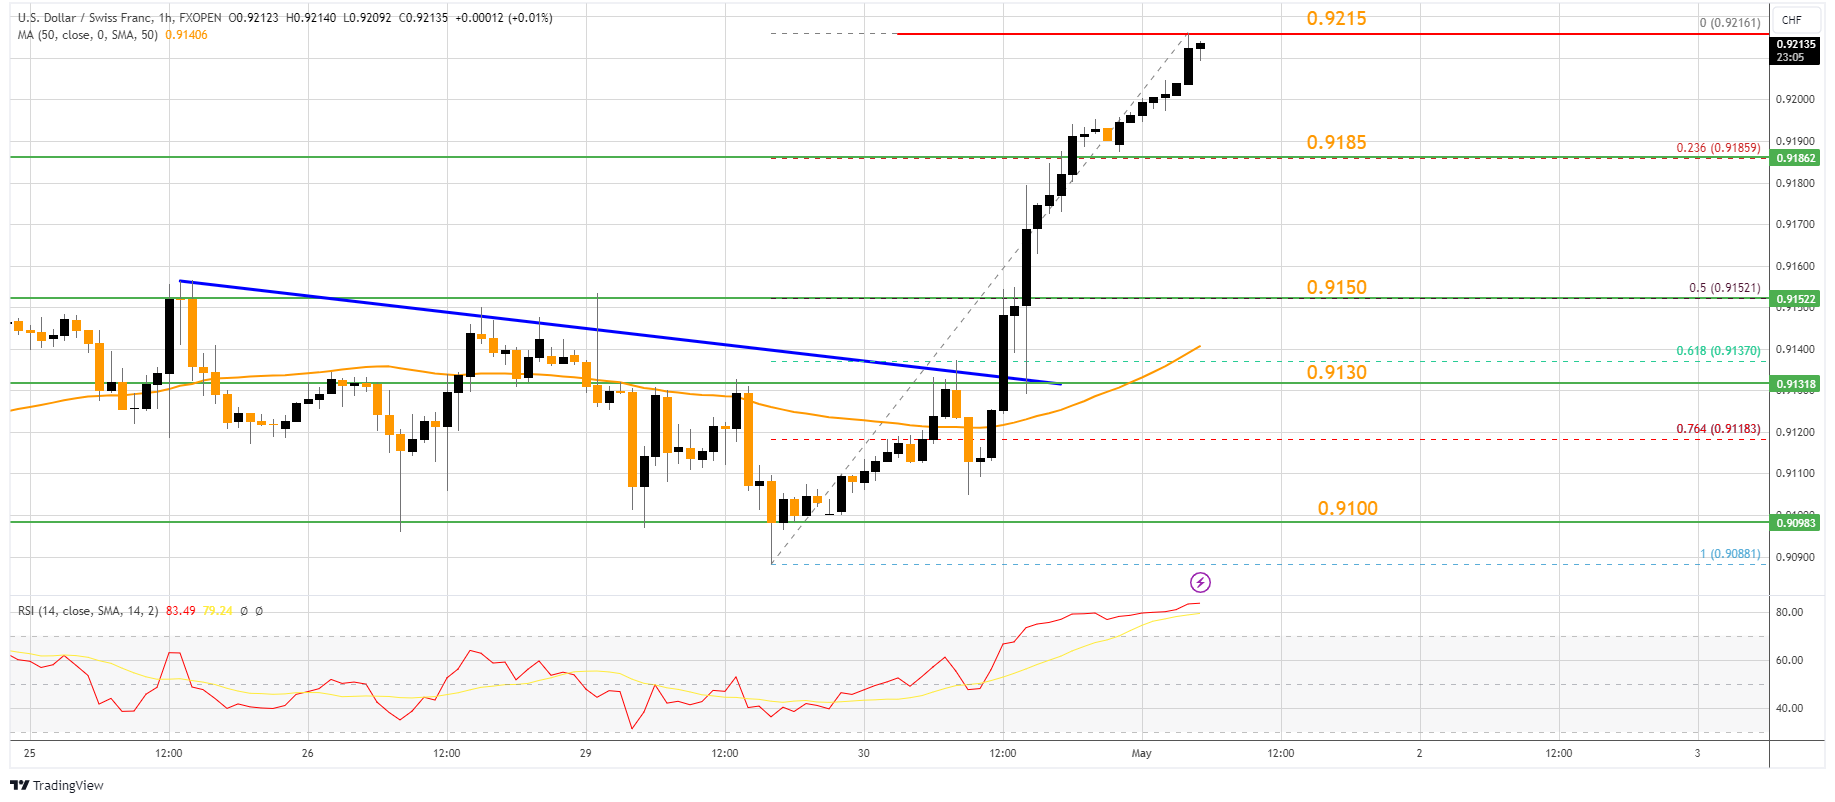
A high was formed near 0.9216 and the pair is still showing signs of more upsides. On the upside, the pair is now facing resistance near 0.9215.
The next major resistance is at 0.9240. The main resistance is now near 0.9250. If there is a clear break above the 0.9250 resistance zone and the RSI remains above 60, the pair could start another increase. In the stated case, it could test 0.9300.
If there is a downside correction, the pair might test the 23.6% Fib retracement level of the upward move from the 0.9088 swing low to the 0.9216 high at 0.9185.
The first major support on the USD/CHF chart is near the 50% Fib retracement level of the upward move from the 0.9088 swing low to the 0.9216 high at 0.9150. A downside break below 0.9150 might spark bearish moves. The next major support is near the 0.9130 pivot level. Any more losses may possibly open the doors for a move toward the 0.9100 level in the near term.
Trade over 50 forex markets 24 hours a day with FXOpen. Take advantage of low commissions, deep liquidity, and spreads from 0.0 pips (additional fees may apply). Open your FXOpen account now or learn more about trading forex with FXOpen.
This article represents the opinion of the Companies operating under the FXOpen brand only. It is not to be construed as an offer, solicitation, or recommendation with respect to products and services provided by the Companies operating under the FXOpen brand, nor is it to be considered financial advice.
Stay ahead of the market!
Subscribe now to our mailing list and receive the latest market news and insights delivered directly to your inbox.


Latest articles

US Dollar Index: A Defining Week for the King of the Markets
The dollar heads into a pivotal week trading near 101.80, just off a 15-month high, with the Fed's July 29 meeting standing as the clear focal point. Markets currently price roughly a 65% chance of a hold, though renewed

NZD/USD: Inflation Surge Meets Strong US Dollar Pressure
On 21 July, Stats NZ reported an acceleration in inflation: the Consumer Price Index rose 1.5% in the second quarter, while the annual inflation rate climbed to 4.1%, its highest level in more than two years and slightly

Weekly Market Insights with Gary Thomson: The Week of Central Banks and Earnings
In this video, we’ll explore the key economic events and market trends, shaping the financial landscape. Get ready for insights into financial markets to help you navigate the week ahead. Let’s dive in!
In this episode of Market