


Brent Crude Price: Ceasefire Wipes Out the Geopolitical Premium
FXOpen

For several weeks, the oil market remained directly influenced by the US-Iran tensions. Threats to close the Strait of Hormuz kept Brent prices within the $97–110 range. Overnight on 8 April, the parties announced a two-week ceasefire, and the Strait of Hormuz reopened to shipping, immediately removing the accumulated geopolitical premium from prices. Brent declined by over 10%, falling towards the $92 per barrel level.
However, later the same day, the ceasefire came under pressure. Gulf states reported Iranian drone and missile strikes, with the UAE, Kuwait, and Bahrain confirming attacks on oil facilities and infrastructure. Iran subsequently suspended vessel transit through the Strait of Hormuz, citing a breach of the agreement by Israel, which had conducted strikes in Lebanon. Israel clarified that the ceasefire does not apply to Lebanon.
Negotiations are scheduled for 10 April in Islamabad, although the outcome remains uncertain. The market continues to show high sensitivity to any changes in diplomatic or military rhetoric. In parallel, OPEC+ approved an increase in oil production quotas on Sunday, adding further supply-side pressure.
Technical Picture
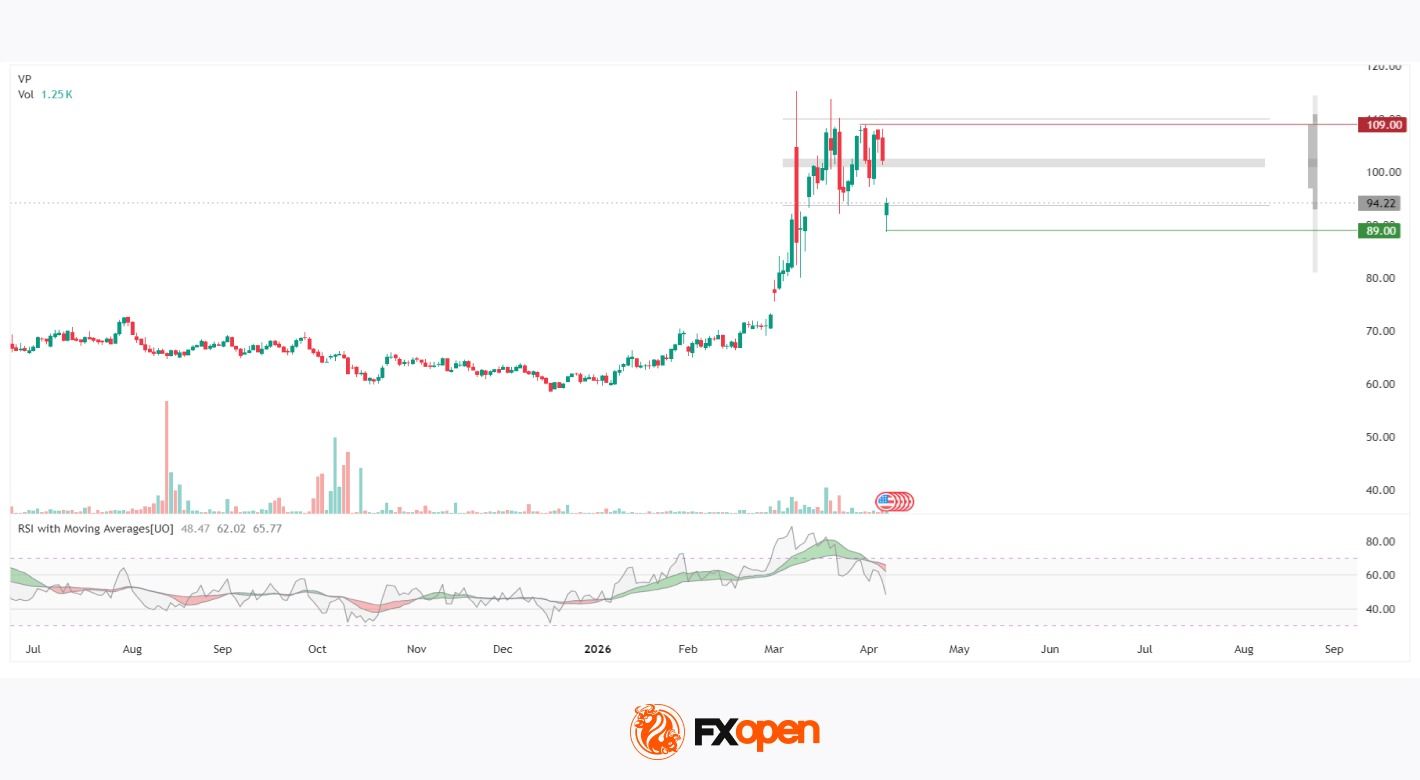
On the daily chart, the prolonged consolidation within the $60–75 range appears to have ended with an impulsive rally towards $115, likely driven by geopolitical escalation in February–March 2026. Notably, on 18 March, vertical volume recorded a peak spike, which may confirm the climactic nature of the move.
The market was unable to sustain these elevated levels, and the subsequent correction has pushed prices down to $89, where price is now approaching the lower boundary of a horizontal volume cluster. Above current levels, the market profile remains dense, with the highest concentration of trading activity (POC) located in the $101–103 range. This area may act as the nearest upside reference, though any breakout would likely require significant buyer participation. The next resistance level is seen near $109.
For sellers, the key support level may be $89. A break below this level would align with the base of the previous session and could reinforce short-term bearish positioning.
The RSI with Moving Averages (nominal) indicator presents a similarly notable picture. The RSI has remained below both moving averages for the past 10 days, with both MAs trending downward, which may signal a weakening bullish impulse and a shift towards a neutral-to-bearish oscillator configuration.
Key Takeaways
Brent prices have corrected sharply following the removal of the geopolitical premium and increased supply pressure from OPEC+. From a technical perspective, price remains below the POC zone, while the RSI+MA configuration continues to reflect a bearish context. The key range levels—$89 and $109—may act as reference points for the upcoming sessions.
Start trading commodity CFDs with tight spreads (additional fees may apply). Open your trading account now or learn more about trading commodity CFDs with FXOpen.
This article represents the opinion of the Companies operating under the FXOpen brand only. It is not to be construed as an offer, solicitation, or recommendation with respect to products and services provided by the Companies operating under the FXOpen brand, nor is it to be considered financial advice.
Stay ahead of the market!
Subscribe now to our mailing list and receive the latest market news and insights delivered directly to your inbox.


Latest articles

CAD/JPY: The Yen's Most Historic Move in 30 Years Meets a Fragile Support
Two central banks are heading in genuinely opposite directions this week, and the tension is unmistakable. The Bank of Canada held rates steady at 2.25% on September 2, with a mildly hawkish tilt as policymakers acknowledged a broadening economic

USD/JPY and USD/CAD Await Key Fed Decision
The US dollar is consolidating against the yen and Canadian dollar ahead of the key event of the week — the Federal Reserve meeting. The Fed is widely expected to raise its policy rate by 25 basis points to a range

UnitedHealth: Fundamentals Are Healing, Now the Chart Must Agree
UnitedHealth finds itself in a genuinely split narrative right now, trading near $388, down about 15.9% from its 52-week high, even as the fundamental picture keeps improving. Q2 earnings beat expectations, with revenue of $112.03 billion, and the