


ETH/USD Analysis: False Wedge Breakout Amid Diverging Bitcoin and Ethereum ETF Inflows
FXOpen

Capital inflows into spot Bitcoin ETFs reached $986.9 million in the week ending 5 September 2026. Over the past three weeks, cumulative inflows have totalled $3.8 billion, marking the strongest three-week performance for these funds in 2026. Over the same period, spot Ethereum ETFs attracted $218.4 million, down from $824.4 million the previous week, representing a roughly 74% decline in inflows.
Against this backdrop, Ethereum continues to prepare for the Gl Amsterdam upgrade, which is expected to launch on the mainnet in Q4 2026, although an exact date has yet to be confirmed. The upgrade is aimed at further scaling the network and improving the efficiency of transaction and data processing. These factors provide the fundamental backdrop for ETH following its strong rally in the second half of August.
Technical Analysis of ETH/USD
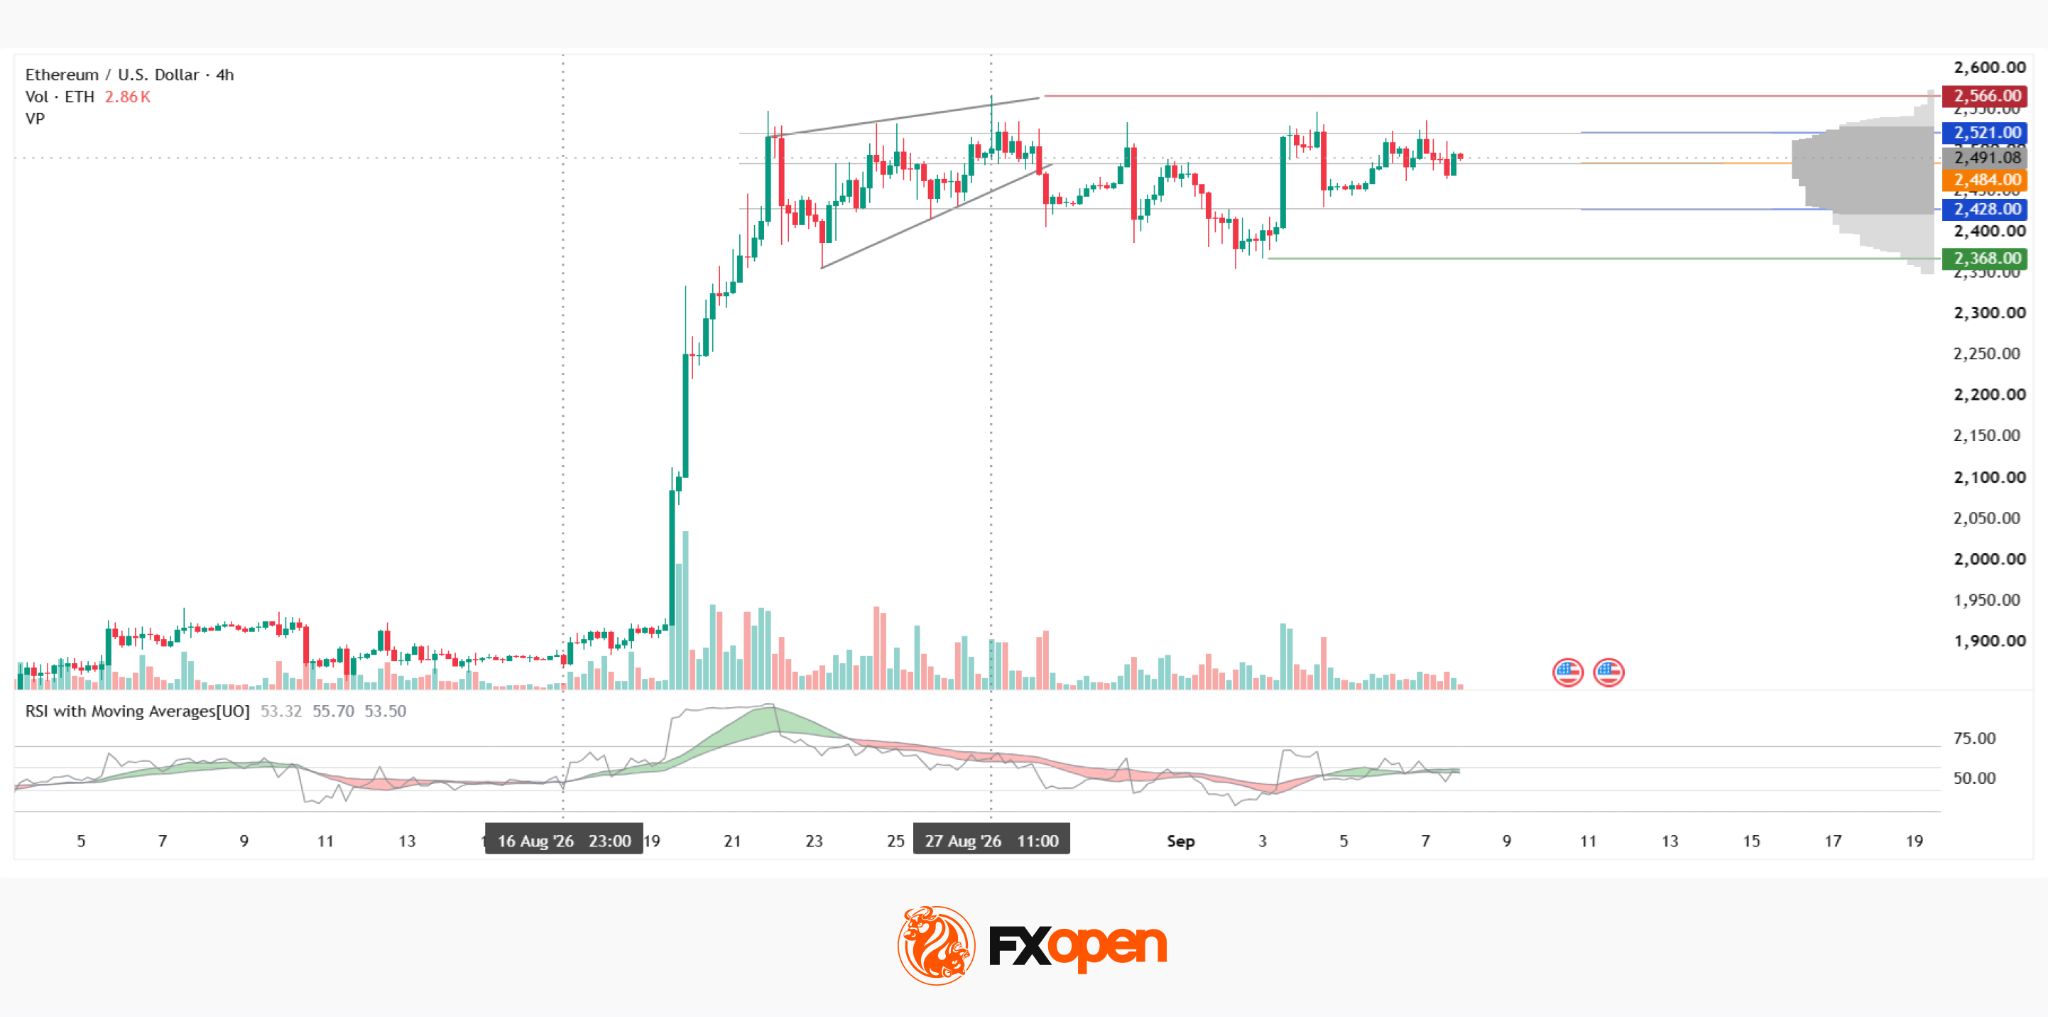
The four-hour ETH/USD chart shows a pronounced uptrend that began with a sharp impulse on volume significantly above the average levels seen in previous weeks. An ascending wedge formed near the top of this move, with price fluctuations gradually narrowing to create a classic pattern. At the end of August, the price attempted to break out of the wedge to the downside, but the breakout failed to develop, with the market returning to the boundaries of the developing market profile.
Trading within the current boundaries has continued for a relatively long period, which could indicate that energy is building ahead of the next significant move. The price is currently moving between the Point of Control (POC) at $2,484 and the upper boundary of the profile at $2,521.
Above the current market profile, near the top of the trend, there is a red resistance area around $2,566. Below it lies a green support area at $2,368, which would only become accessible if the price first breaks through the lower boundary of the profile at $2,428.
The RSI + MAs indicator is showing readings of 53, 55 and 53. The oscillator and both moving averages are holding below the upper boundary of the neutral zone and are attempting to move higher, while the moving-average lines are green.
Key Takeaways
The prolonged consolidation following the failed downside wedge breakout has yet to determine the pair’s next direction, while the RSI + MAs readings add to the potential recovery scenario. The flow of capital into spot Ethereum ETFs remains an additional point of reference for Ethereum.
FXOpen offers the world's most popular cryptocurrency CFDs*, including Bitcoin and Ethereum. Floating spreads, 1:2 leverage — at your service (additional fees may apply). Open your trading account now or learn more about crypto CFD trading with FXOpen.
*Important: At FXOpen UK, Cryptocurrency trading via CFDs is only available to our Professional clients. They are not available for trading by Retail clients. To find out more information about how this may affect you, please get in touch with our team.
This article represents the opinion of the Companies operating under the FXOpen brand only. It is not to be construed as an offer, solicitation, or recommendation with respect to products and services provided by the Companies operating under the FXOpen brand, nor is it to be considered financial advice.
Stay ahead of the market!
Subscribe now to our mailing list and receive the latest market news and insights delivered directly to your inbox.


Latest articles

CAD/JPY: The Yen's Most Historic Move in 30 Years Meets a Fragile Support
Two central banks are heading in genuinely opposite directions this week, and the tension is unmistakable. The Bank of Canada held rates steady at 2.25% on September 2, with a mildly hawkish tilt as policymakers acknowledged a broadening economic

USD/JPY and USD/CAD Await Key Fed Decision
The US dollar is consolidating against the yen and Canadian dollar ahead of the key event of the week — the Federal Reserve meeting. The Fed is widely expected to raise its policy rate by 25 basis points to a range

UnitedHealth: Fundamentals Are Healing, Now the Chart Must Agree
UnitedHealth finds itself in a genuinely split narrative right now, trading near $388, down about 15.9% from its 52-week high, even as the fundamental picture keeps improving. Q2 earnings beat expectations, with revenue of $112.03 billion, and the