


Meta: V-Shaped Recovery Meets Heavy Volume Resistance
FXOpen

The movement in Meta Platforms shares is being driven by two competing narratives. On one hand, advertising revenue is benefiting from AI-based tools: the Advantage+ platform continues to support strong advertiser demand, and the analyst consensus for Q1 2026 revenue stands at around $55.5 billion—near the upper end of the company’s guidance range of $53.5–56.5 billion. On the other hand, investors remain cautious about planned capital expenditure of $115–135 billion for 2026, which is weighing on free cash flow. The company’s earnings release is scheduled for 29 April after the market close.
Technical Overview
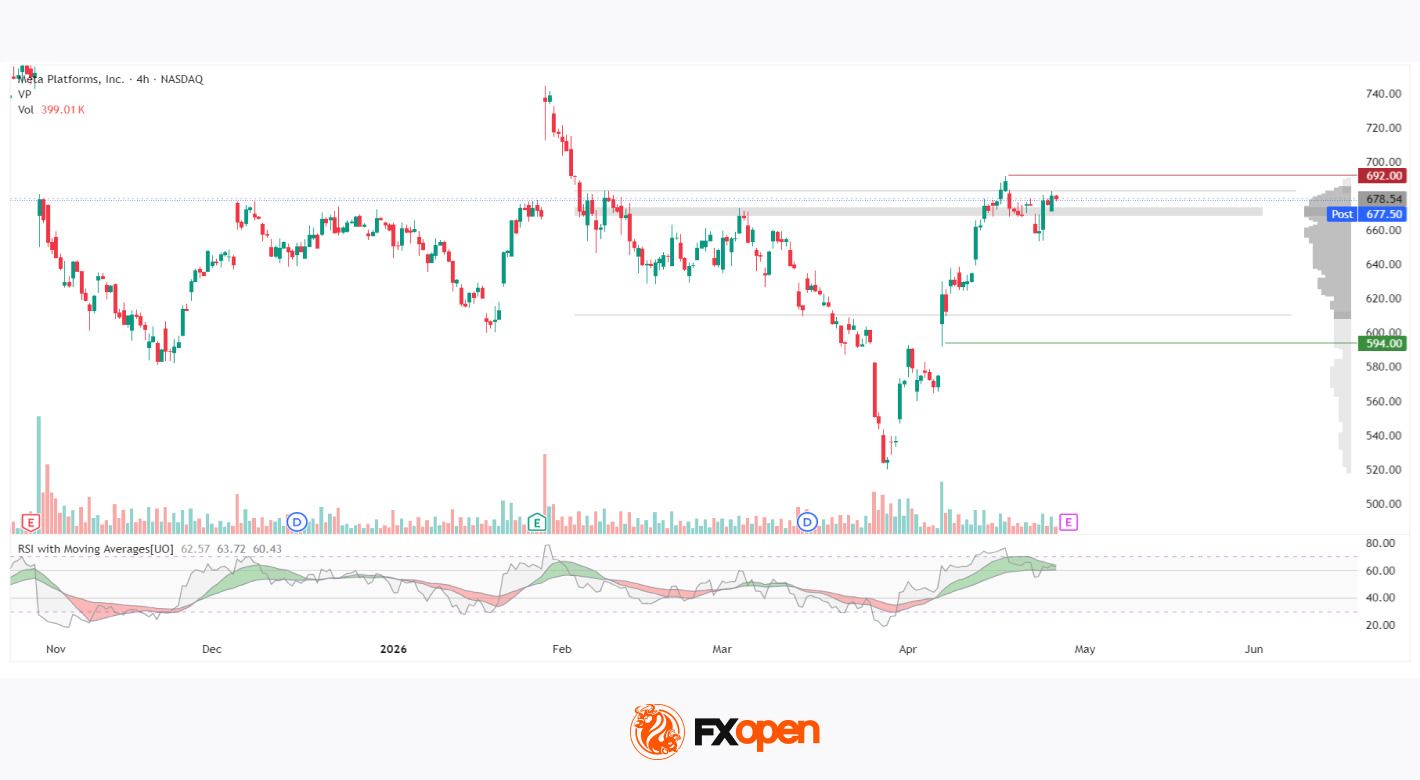
On the 4-hour chart, price action from late January to the end of March appears to have shown clear signs of a downtrend, with the stock falling roughly 30% from $744 to $521. The rebound from this low was sharp and relatively symmetrical, forming what looks like a V-shaped recovery. The return of buyers was accompanied by a notable spike in vertical volume on 8 April, after which the price moved firmly into the market profile range of $610–683.
Within this zone, momentum appears to have slowed. The Point of Control (POC) is concentrated around $668–673. The price is currently trading between this high-volume area and the upper boundary of the profile at $683, where trading activity seems to have been most concentrated over the period. Above current levels, the next key resistance may be located at $692 — the April high. Support at $594 aligns with a gap formed during the strong upward move on elevated volume.
The RSI with moving averages shows readings of 62, 63, and 60. The oscillator sits between two upward-sloping moving averages, suggesting that bullish momentum may still persist, although price action appears to be slowing near the upper edge of the volume range.
Summary
The chart structure may reflect a transition from a deep correction into a recovery phase that is now encountering a dense volume barrier. Price behaviour within the $668–683 range is likely to depend on the upcoming earnings release and whether the company can meet analysts’ expectations amid rising capital expenditure.
Buy and sell stocks of the world's biggest publicly-listed companies with CFDs on FXOpen’s trading platform. Open your FXOpen account now or learn more about trading share CFDs with FXOpen.
This article represents the opinion of the Companies operating under the FXOpen brand only. It is not to be construed as an offer, solicitation, or recommendation with respect to products and services provided by the Companies operating under the FXOpen brand, nor is it to be considered financial advice.
Stay ahead of the market!
Subscribe now to our mailing list and receive the latest market news and insights delivered directly to your inbox.


Latest articles

Weekly Market Insights with Gary Thomson: BoJ, Fed, and Geopolitics
In this video, we’ll explore the key economic events and market trends, shaping the financial landscape. Get ready for insights into financial markets to help you navigate the week ahead. Let’s dive in!
In this episode of Market

Bitcoin Analysis: Iran Peace Deal Sparks Hope — Is Bitcoin Ready to Bounce?
After months of uncertainty and escalating tensions, the United States and Iran have reached a peace agreement that includes the reopening of the Strait of Hormuz. The deal appears solid for now, though markets remain cautious — particularly given President Trump's

Nikkei 225 Strengthens Ahead of the Bank of Japan Decision
Investors are focused on the Bank of Japan's policy meeting on 16 June. According to a Reuters survey published on 10 June, the majority of economists expect the benchmark interest rate to be raised to 1% — a level not seen