


Microsoft Shares Two Days Ahead of Earnings Release
FXOpen

In January, Microsoft shares came under pressure following the company’s earnings report. Although both revenue and earnings per share exceeded analysts’ expectations, growth in the Azure cloud platform slowed to 39% year-on-year from 40% in the previous quarter—enough to disappoint investors. The market is now preparing for the next release: on 29 April, after the close of trading, Microsoft will publish results for the third quarter of its 2026 financial year. Analysts forecast adjusted EPS at $4.04, up 17% from the same period last year. The focus remains on Azure’s performance and the expansion of the paid user base for Copilot within Microsoft 365.
Technical Overview
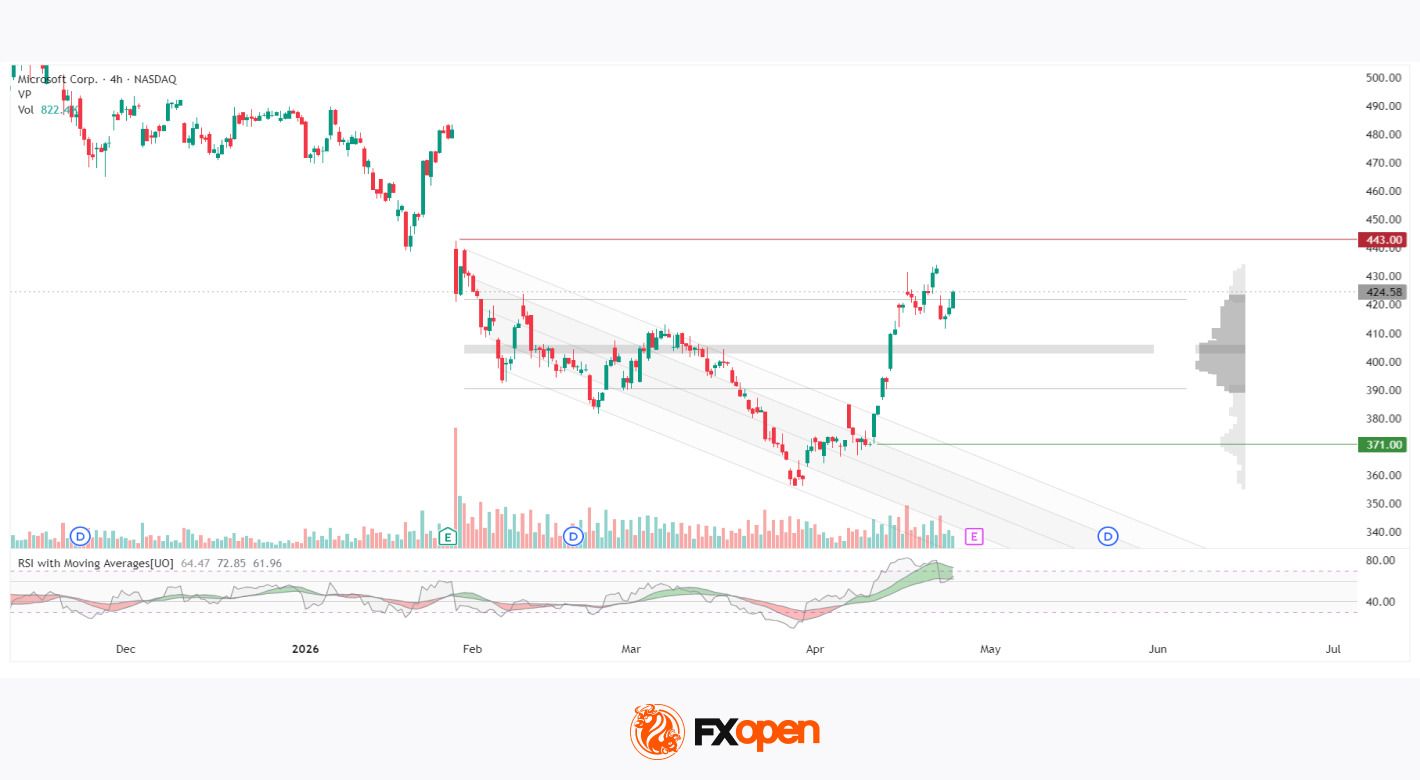
Until late January, Microsoft shares appear to have moved sideways, but the 29 January earnings release triggered a sharp gap down accompanied by an abnormal surge in vertical volume, which likely prompted a rapid repricing of the asset. This move may have laid the foundation for a well-defined downward channel, with price steadily declining along its boundaries to a low near $357 by the end of March. In April, a recovery pushed the price to around $433, followed by consolidation within the $412–$433 range, where it currently remains ahead of the upcoming earnings announcement.
The horizontal volume balance zone is located at $403–$406, with the broader market profile spanning $390–$422 — current prices are trading above the bulk of accumulated volume. The nearest significant resistance may be located at $443, while support levels are seen at $390 and $371. The RSI with moving averages shows readings of 64 / 72 / 61: the oscillator sits between two upward-sloping moving averages, suggesting a bullish bias within the consolidation phase.
Summary
The $412–$433 consolidation range may be forming just ahead of the 29 April earnings release—an event similar to the one in January that triggered a two-month decline. The volume profile suggests that prices remain above the balance zone at $403–$406, while RSI holds in positive territory. The market’s reaction to the upcoming results will likely determine whether the recovery extends further or the price returns to the prior accumulation zone.
Buy and sell stocks of the world's biggest publicly-listed companies with CFDs on FXOpen’s trading platform. Open your FXOpen account now or learn more about trading share CFDs with FXOpen.
This article represents the opinion of the Companies operating under the FXOpen brand only. It is not to be construed as an offer, solicitation, or recommendation with respect to products and services provided by the Companies operating under the FXOpen brand, nor is it to be considered financial advice.
Stay ahead of the market!
Subscribe now to our mailing list and receive the latest market news and insights delivered directly to your inbox.


Latest articles

US Dollar Index: A Defining Week for the King of the Markets
The dollar heads into a pivotal week trading near 101.80, just off a 15-month high, with the Fed's July 29 meeting standing as the clear focal point. Markets currently price roughly a 65% chance of a hold, though renewed

NZD/USD: Inflation Surge Meets Strong US Dollar Pressure
On 21 July, Stats NZ reported an acceleration in inflation: the Consumer Price Index rose 1.5% in the second quarter, while the annual inflation rate climbed to 4.1%, its highest level in more than two years and slightly

Weekly Market Insights with Gary Thomson: The Week of Central Banks and Earnings
In this video, we’ll explore the key economic events and market trends, shaping the financial landscape. Get ready for insights into financial markets to help you navigate the week ahead. Let’s dive in!
In this episode of Market