


Netflix 2026: Reversal on the Deal, Pullback on Earnings
FXOpen

Fundamental Background
At the end of February, Netflix withdrew from the bid for Warner Bros. Discovery assets after WBD’s board deemed Paramount Skydance’s $31-per-share offer more attractive. Netflix chose not to raise its own bid of $27.75 per share and received compensation of $2.8 billion. The market reacted positively to the company’s exit from the months-long M&A battle, as the threat of adding more than $40 billion in debt to the balance sheet was removed.
The second key event was the company’s Q1 2026 earnings report, released on 16 April. Revenue reached $12.25 billion (+16% year-on-year), while earnings per share came in at $1.23, exceeding consensus forecasts. However, guidance for Q2 fell short of analysts’ expectations for both revenue and EPS, while company founder Reed Hastings announced plans to step down from the board in June. Together, these factors triggered a sharp negative market reaction in April.
Technical Picture
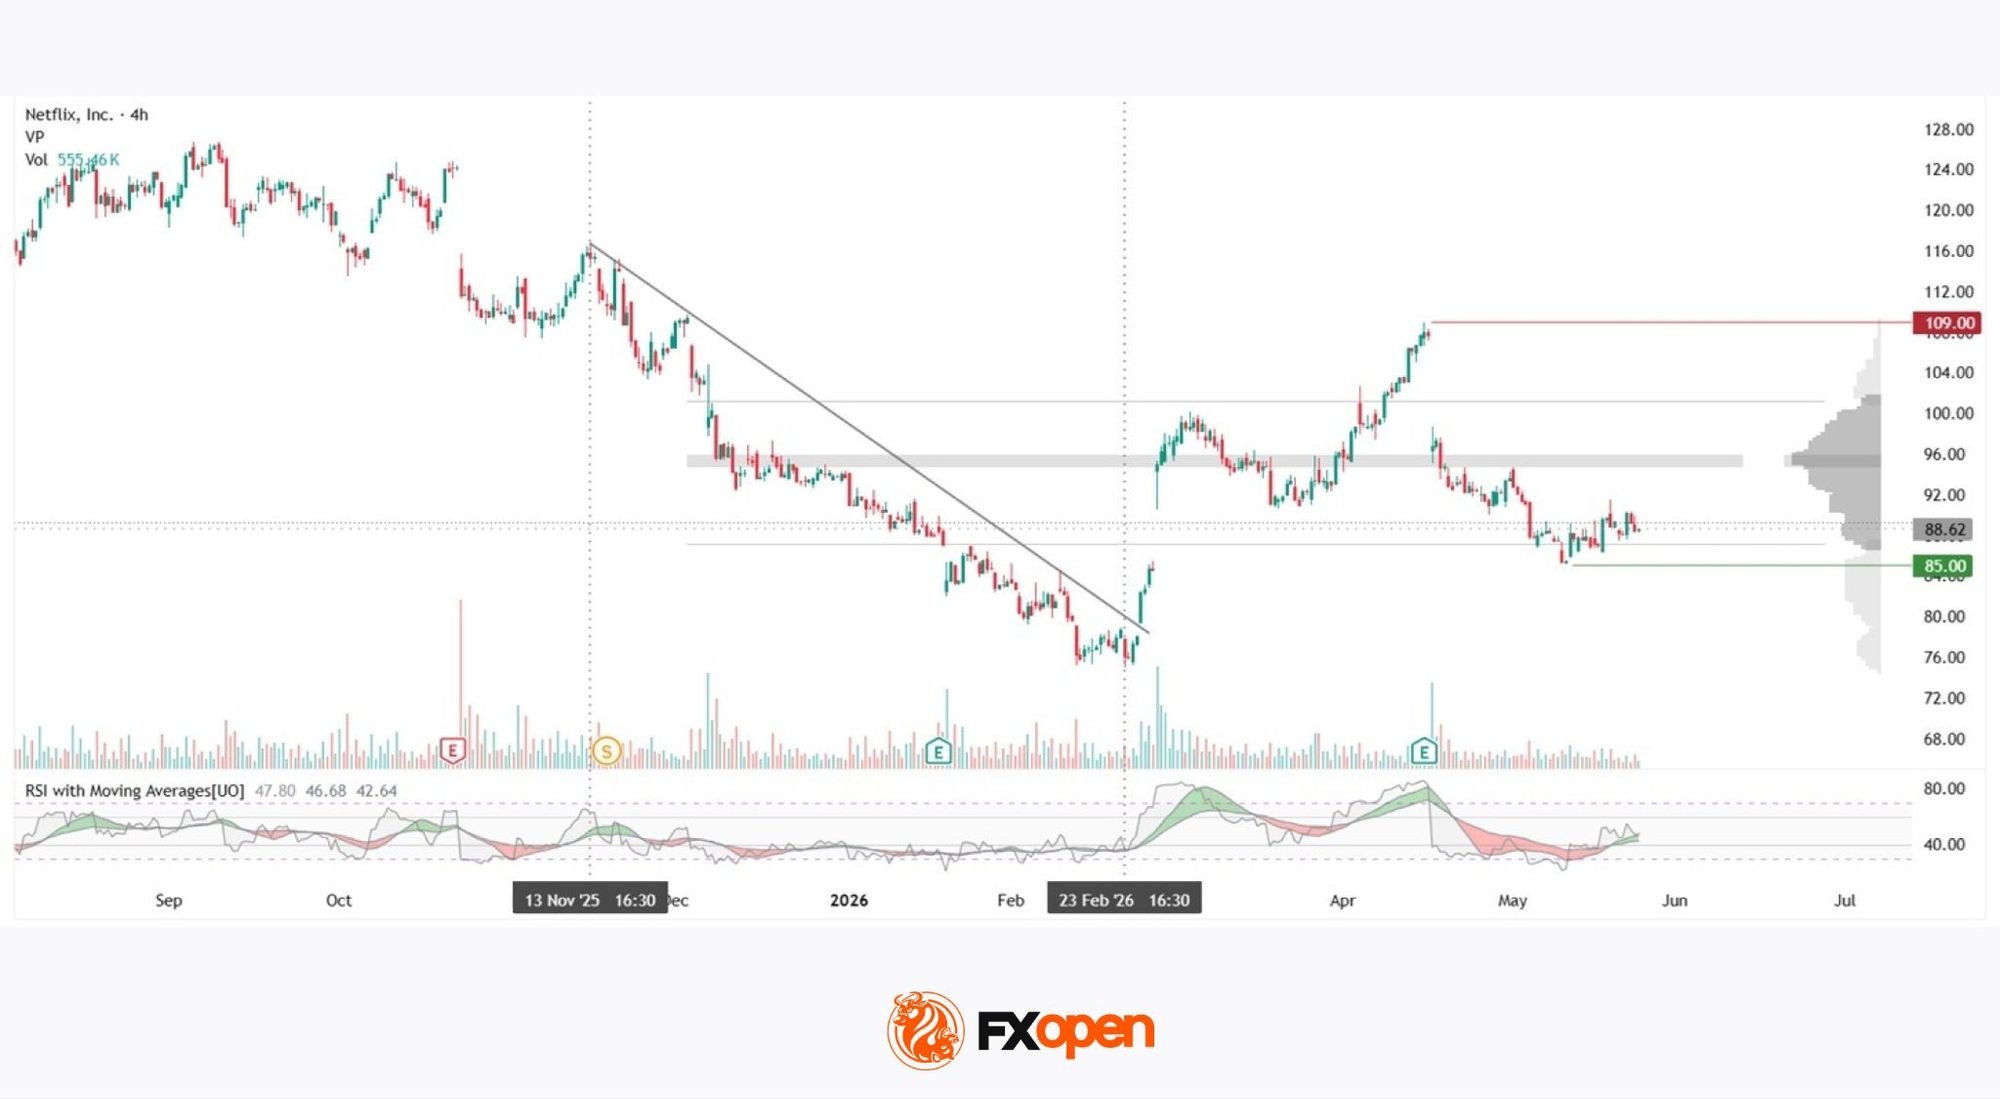
The long-term downtrend in Netflix shares began in July 2025, when the stock was trading near historic highs around $134. The period from 13 November 2025 to 23 February 2026 marked the final phase of this trend, during which the price declined towards $75.
The gap on 27 February 2026 — a direct consequence of the company’s withdrawal from the WBD deal — broke the descending trendline and was accompanied by an abnormal surge in vertical trading volume. The subsequent rally pushed the stock towards $109, which may now act as a resistance zone on any renewed advance. The gap on 17 April reversed the move lower, also on elevated volume, returning the price to the range of the current volume profile.
At present, the shares are trading slightly above the lower boundary of the profile, while the Point of Control (POC) zone lies around $94.50–$96.00 and may serve as a reference point in the event of a recovery. The $85.00 area could become the nearest significant support below the profile. RSI with moving averages currently shows readings of 47 / 46 / 42 — all three lines remain below the 50 mark and have yet to form any impulsive structure.
Key Takeaways
Netflix’s technical structure reflects two polar opposite events within the same year: the breakout of the long-term downtrend following a corporate event, and the subsequent correction after disappointing guidance. The stock’s next direction will largely depend on whether the market can hold above the lower boundary of the profile and how convincing the company’s operational progress proves to be in Q2.
Buy and sell stocks of the world's biggest publicly-listed companies with CFDs on FXOpen’s trading platform. Open your FXOpen account now or learn more about trading share CFDs with FXOpen.
This article represents the opinion of the Companies operating under the FXOpen brand only. It is not to be construed as an offer, solicitation, or recommendation with respect to products and services provided by the Companies operating under the FXOpen brand, nor is it to be considered financial advice.
Stay ahead of the market!
Subscribe now to our mailing list and receive the latest market news and insights delivered directly to your inbox.


Latest articles

EUR/USD: All Eyes on the Fed as the Range Reaches Its Breaking Point
The dollar's next move hinges on tonight's Fed decision, and this time markets genuinely don't know what to expect. While economists still lean toward a hold—with CME FedWatch odds sitting near 68.5% for no change—Kevin Warsh's hawkish

USD/JPY and USD/CAD Test Resistance Ahead of Fresh Fed Signals
The US dollar continues to hold the upper hand against most major currencies ahead of the outcome of the latest Federal Reserve meeting. While the base-case scenario remains for interest rates to stay unchanged, markets are also pricing in the

Amazon Earnings: Does the Chart Already Know Something the Numbers Don't?
All eyes are on July 30, when Amazon reports Q2 2026 earnings, with Wall Street increasingly convinced the bar has been set too low. Consensus sees EPS near $1.82-$2.26 on roughly $197 billion in revenue, but the