


XAG/USD Analysis: Triangle Breakout Attempt Amid US Treasury Buybacks
FXOpen

On 19 August, the US Treasury announced that it would double the volume of long-term government bond buybacks. The measure led to a noticeable decline in yields at the longer end of the curve and forms part of the Treasury’s broader efforts to contain pressure on long-term borrowing costs. These efforts include market interventions and calls for the Federal Reserve to expand the limits of the FIMA repo facility.
Lower Treasury yields improve the relative appeal of precious metals, which do not generate interest income, providing direct support for silver. Industrial demand is another important factor. Chinese imports of silver-containing ores rose 62.5% year-on-year in June amid expanding production of solar panels and power-grid equipment.
Technical Analysis of Silver
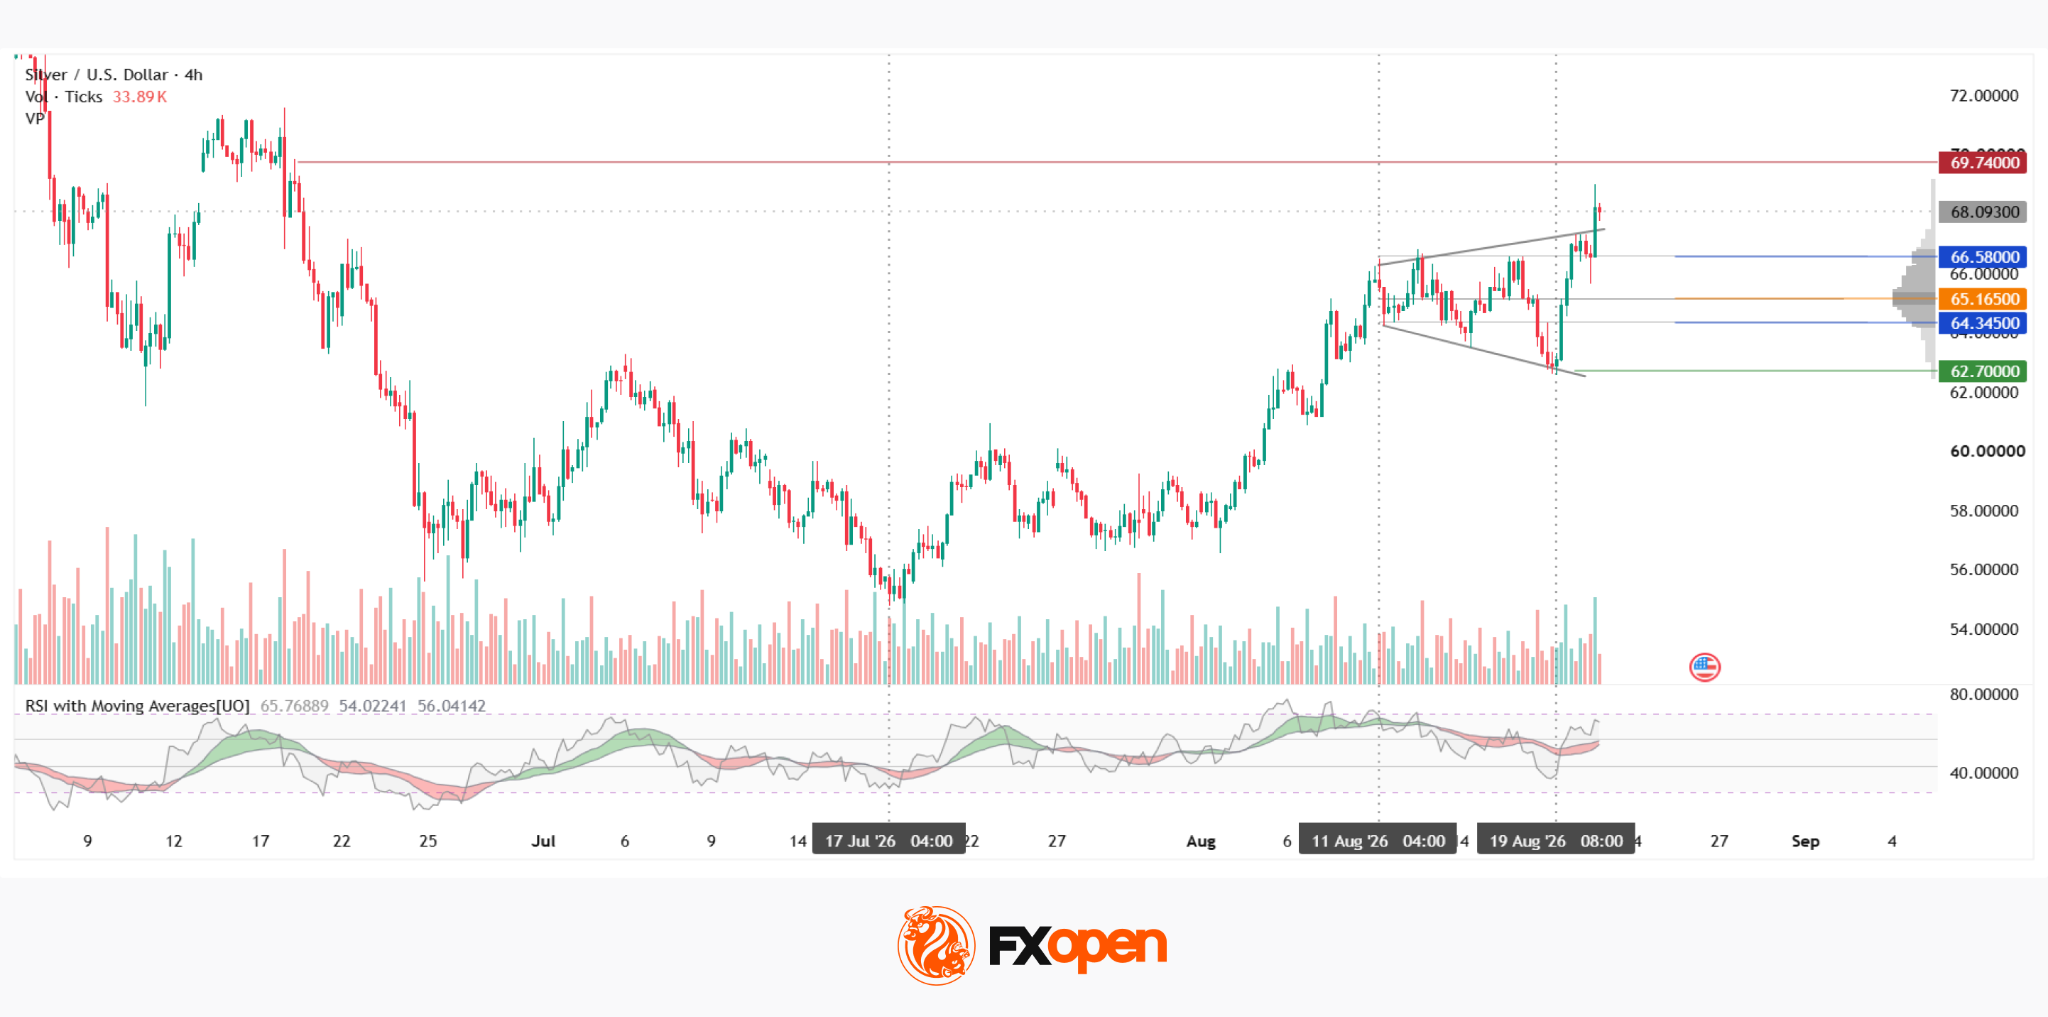
Since 17 July, XAG/USD has been moving within a pronounced uptrend on the four-hour chart. In the upper portion of this advance, a pattern resembling a broadening triangle emerged in mid-August. Unlike a conventional triangle, its boundaries widened rather than converged, reflecting increasing volatility during the consolidation phase.
On 20 August, the price broke above the formation and continued to hold above the current market profile. The breakout candle was accompanied by a noticeable increase in vertical volume compared with the preceding consolidation bars, adding some confirmation to the move.
Following the breakout, silver moved above the profile’s upper boundary at $66.58. If the bullish momentum persists, the next major upside reference is the red resistance level at $69.74.
A return inside the profile would shift attention to the cluster of two important levels: the Point of Control (POC) at $65.165 and the lower profile boundary at $64.345. Their proximity makes this area particularly important for the short-term outlook. If sellers push the price through this cluster, the next potential support could be found around the green level at $62.700.
The RSI + MAs indicator currently shows readings of 66, 56 and 56. The oscillator is trading above the neutral zone, while both moving averages remain below its upper boundary and are only beginning to approach a potential breakout.
Key Takeaways
The breakout above the broadening triangle on increased volume initially points towards further upside, but maintaining prices above the market profile will require additional confirmation.
The $66.58 level is therefore likely to remain important in the near term: holding above it would favour continuation towards $69.74, while a return below the profile could bring the 65.165–64.345 area back into focus.
The broader outlook will also remain sensitive to the direction of US Treasury yields. A continued decline in yields could provide further support for silver, while a renewed rise in long-term yields could limit the metal’s upside.
Start trading commodity CFDs with tight spreads (additional fees may apply). Open your trading account now or learn more about trading commodity CFDs with FXOpen.
This article represents the opinion of the Companies operating under the FXOpen brand only. It is not to be construed as an offer, solicitation, or recommendation with respect to products and services provided by the Companies operating under the FXOpen brand, nor is it to be considered financial advice.
Stay ahead of the market!
Subscribe now to our mailing list and receive the latest market news and insights delivered directly to your inbox.


Latest articles

CAD/JPY: The Yen's Most Historic Move in 30 Years Meets a Fragile Support
Two central banks are heading in genuinely opposite directions this week, and the tension is unmistakable. The Bank of Canada held rates steady at 2.25% on September 2, with a mildly hawkish tilt as policymakers acknowledged a broadening economic

USD/JPY and USD/CAD Await Key Fed Decision
The US dollar is consolidating against the yen and Canadian dollar ahead of the key event of the week — the Federal Reserve meeting. The Fed is widely expected to raise its policy rate by 25 basis points to a range

UnitedHealth: Fundamentals Are Healing, Now the Chart Must Agree
UnitedHealth finds itself in a genuinely split narrative right now, trading near $388, down about 15.9% from its 52-week high, even as the fundamental picture keeps improving. Q2 earnings beat expectations, with revenue of $112.03 billion, and the