


XNG/USD Analysis: Geopolitical Risk Meets a Fading Uptrend
FXOpen
Natural gas has been on a genuinely volatile ride this week, briefly topping $3.00/MMBtu on Tuesday before reversing sharply lower as fading cooling demand outweighed strong LNG export needs. The commodity, currently trading near $2.91, remains up roughly 4% over the past month despite sitting nearly 7% below year-ago levels.
The supply side tells a comfortable story: US inventories sit 5.2% above the five-year seasonal average, and Lower 48 output remains near record highs, both capping any sustained rally. Yet demand is anything but boring. LNG feedgas flows to major export facilities climbed to 18.3 bcfd in early September from 17.2 bcfd in August as Texas plants returned from maintenance, while European and Asian buyers scramble to rebuild storage ahead of winter amid continued disruptions to Persian Gulf LNG supplies.
That geopolitical thread is the real wildcard. Renewed attacks on tankers in the Strait of Hormuz over the weekend pushed European gas prices to their highest level in over three years, with Qatar largely suspending LNG shipments and extending force majeure on cargoes through autumn.
The result: a domestic market well-supplied and range-bound, sitting uneasily beneath an international backdrop that could send prices sharply higher if Gulf tensions escalate further.
Technical Analysis of XNG/USD
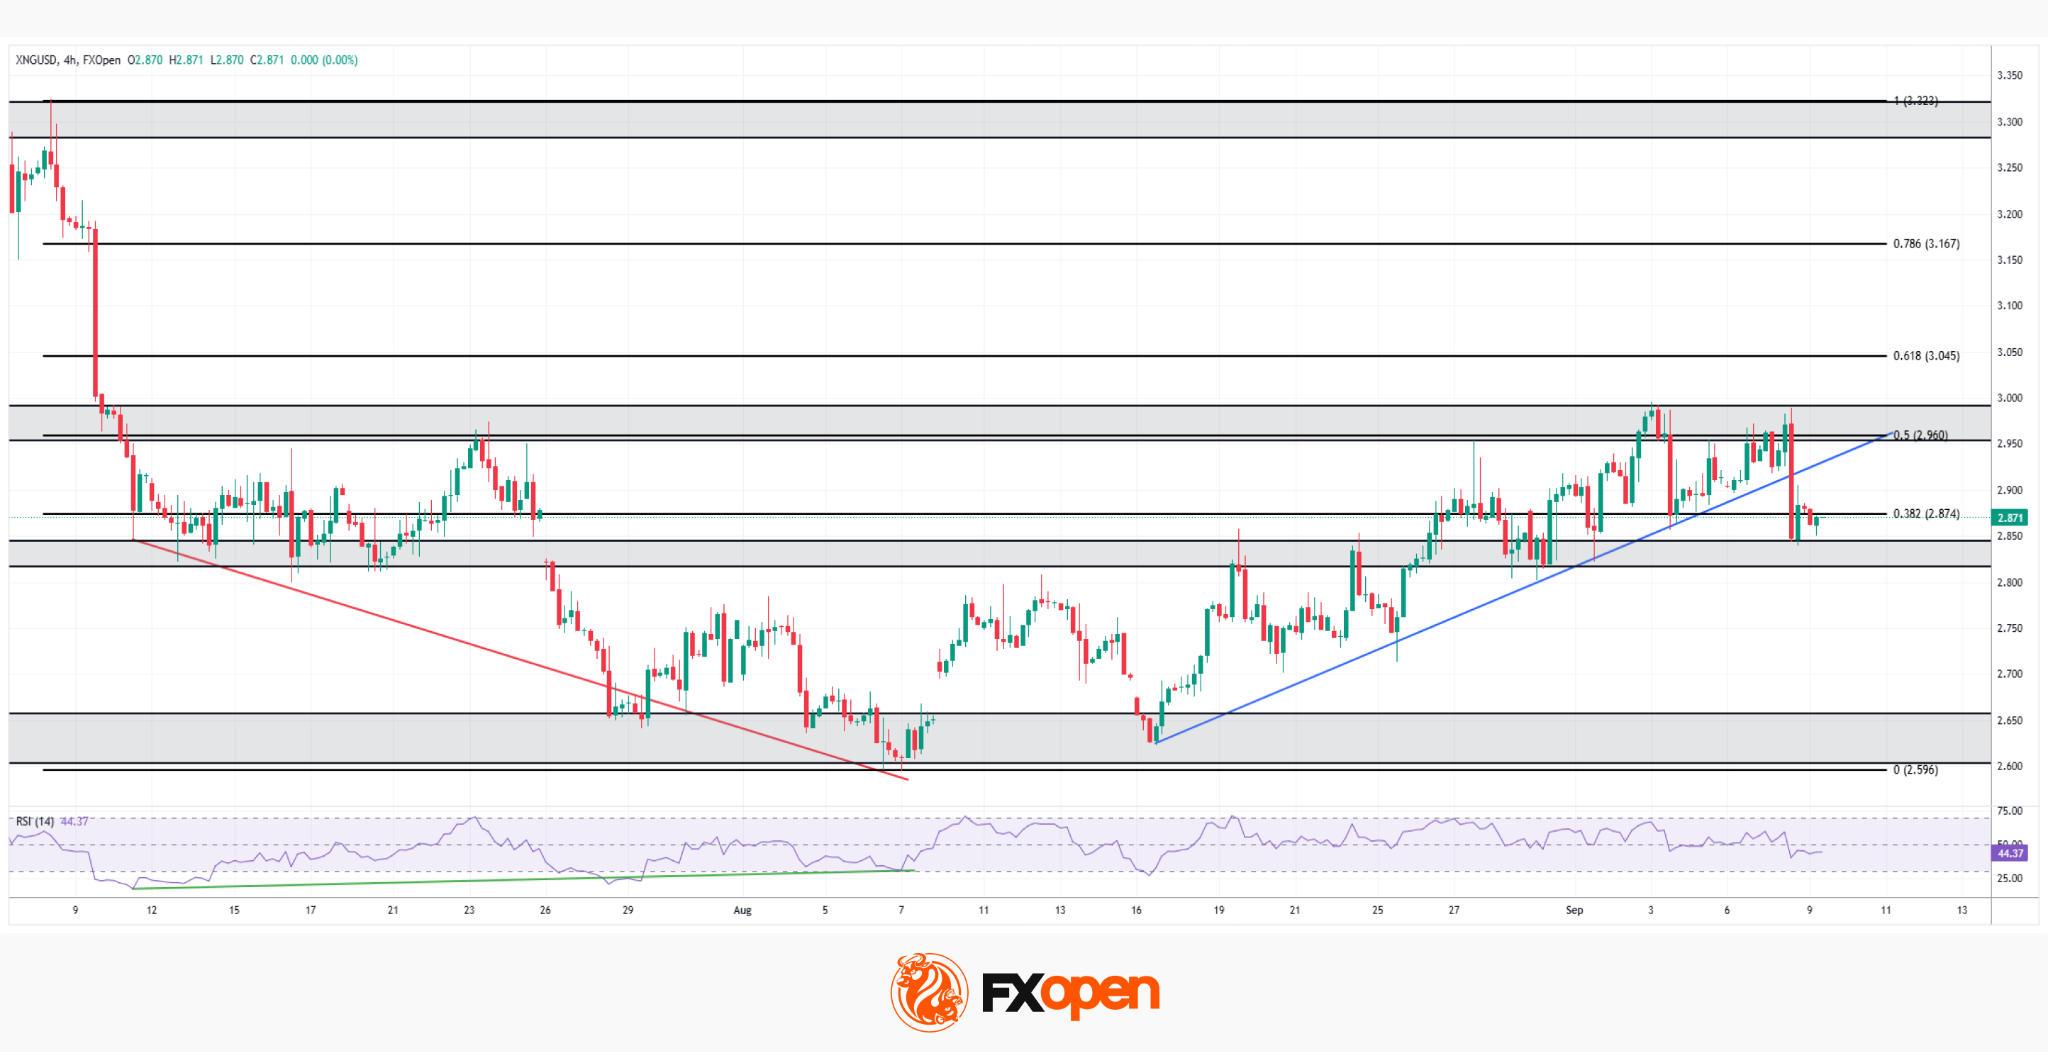
As the XNG/USD chart shows, natural gas staged a strong recovery from a bullish RSI divergence in mid-August, printing higher lows on the RSI even as price carved a fresh low near 2.596, the 0 Fibonacci level. That divergence fuelled a steady uptrend, defined by higher highs and higher lows along an ascending trendline, though price has only just broken below that trendline, currently testing the confluence with the 0.382 retracement near 2.874.
Bullish Scenario
Should buyers reclaim the broken ascending trendline and hold above the 0.382 support, the recovery structure would regain credibility. A push back above the 0.5 retracement near 2.960, the resistance where price has repeatedly reacted in recent sessions, would open the path towards the 0.618 level near 3.045.
Bearish Scenario
Conversely, a confirmed break below the 0.382 retracement would signal that the correction has real legs, exposing the 2.650–2.700 intermediate support zone, with a deeper slide risking a full retest of the 2.596 low that anchored the entire August–September rally.
With price having just lost its ascending trendline right at a key Fibonacci confluence, natural gas's next move looks set to determine whether this recovery still has room to run, or whether the trend shift confirmed by the RSI divergence has already run its course.
Start trading commodity CFDs with tight spreads (additional fees may apply). Open your trading account now or learn more about trading commodity CFDs with FXOpen.
This article represents the opinion of the Companies operating under the FXOpen brand only. It is not to be construed as an offer, solicitation, or recommendation with respect to products and services provided by the Companies operating under the FXOpen brand, nor is it to be considered financial advice.
Stay ahead of the market!
Subscribe now to our mailing list and receive the latest market news and insights delivered directly to your inbox.


Latest articles

CAD/JPY: The Yen's Most Historic Move in 30 Years Meets a Fragile Support
Two central banks are heading in genuinely opposite directions this week, and the tension is unmistakable. The Bank of Canada held rates steady at 2.25% on September 2, with a mildly hawkish tilt as policymakers acknowledged a broadening economic

USD/JPY and USD/CAD Await Key Fed Decision
The US dollar is consolidating against the yen and Canadian dollar ahead of the key event of the week — the Federal Reserve meeting. The Fed is widely expected to raise its policy rate by 25 basis points to a range

UnitedHealth: Fundamentals Are Healing, Now the Chart Must Agree
UnitedHealth finds itself in a genuinely split narrative right now, trading near $388, down about 15.9% from its 52-week high, even as the fundamental picture keeps improving. Q2 earnings beat expectations, with revenue of $112.03 billion, and the