


Microsoft: AI Payoff or AI Overspend — The Chart Weighs In
FXOpen
Microsoft's stock has lived two very different lives in the space of a month. On July 30, shares surged 15.5% in a single session, their biggest one-day jump since 2020, wiping out nearly all of 2026's earlier losses, after fiscal Q4 earnings crushed expectations: Azure revenue growth accelerated to 43% year-over-year, crossing $100 billion in annual revenue for the first time, while Microsoft 365 Copilot surpassed 30 million paid seats.
That euphoria has since cooled. Morgan Stanley sounded a fresh alarm this week, warning that the gap between Microsoft's massive AI capital spending, some $190 billion planned for infrastructure, and the revenue it's actually generating continues to widen, pressuring near-term cash flow. Shares dropped over 3% on the news, adding to a separate wave of investor-lawsuit headlines questioning the company's earlier disclosures.
Still, Wall Street's underlying conviction hasn't wavered: 56 analysts maintain a "Strong Buy" consensus with an average price target above $560. The tension is clear, genuine AI monetization proof from Azure against mounting concerns that the spending required to sustain it may be outpacing the payoff.
Technical Analysis of Microsoft
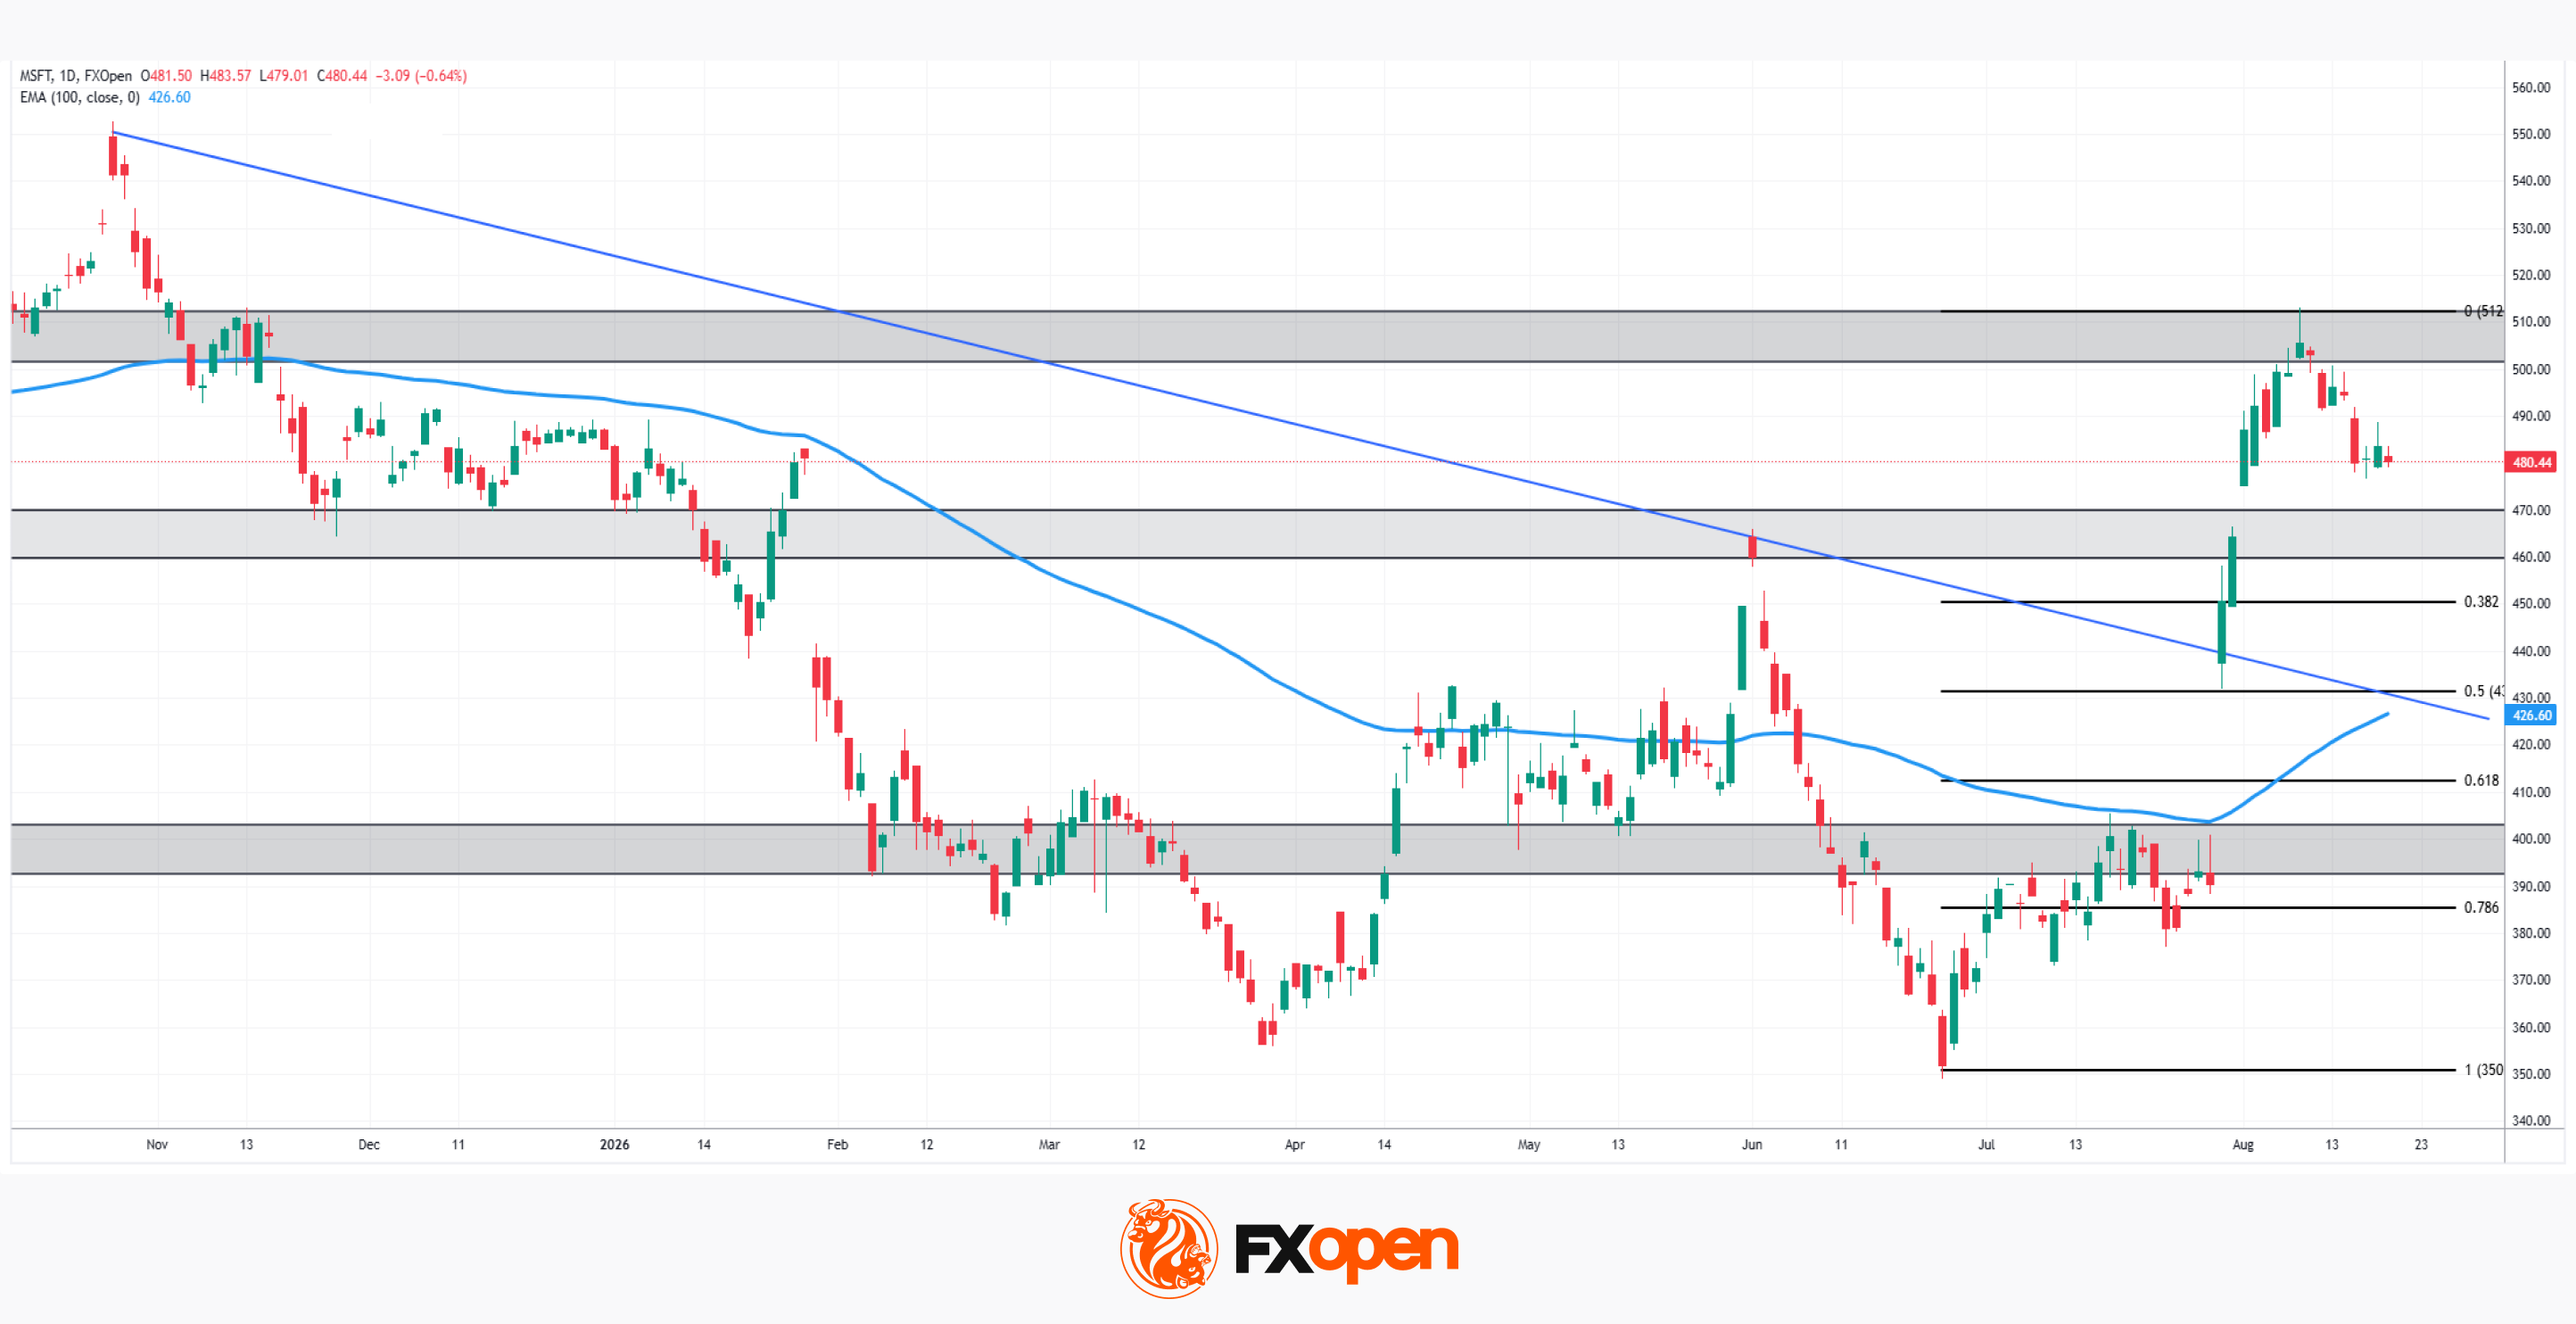
As the daily chart shows, Microsoft broke decisively above the descending trendline from January's highs during July's earnings surge, a genuinely significant technical shift after months of decline. Price has since pulled back from the 512 highs and is now consolidating just above the 460-470 support zone, with the 0.382 and 0.5 Fibonacci retracements, along with the 100-period EMA near $426.60, still sitting well below as the next real tests.
Bullish Scenario
Should buyers defend the 460-470 support and the reclaimed trendline, the breakout structure remains intact. A renewed push higher would target a retest of the 512 highs, the 0 Fibonacci level marking the origin of the entire decline, confirming the July rally has genuine staying power.
Bearish Scenario
Conversely, a break below the 460-470 support would expose the 0.382 retracement first, with a deeper slide bringing price down toward the more significant confluence of the 0.5 Fibonacci retracement and the 100-period EMA near $426-430, a zone that would need to hold to prevent a full reversal of July's breakout. A break below even that would risk exposing the 0.618 level near $410.
With price still comfortably above its key support and the more decisive trendline-EMA confluence still some distance below, Microsoft's next move looks set to determine whether July's historic rally has real staying power, or whether the stock is only beginning to give back its gains.
Buy and sell stocks of the world's biggest publicly-listed companies with CFDs on FXOpen’s trading platform. Open your FXOpen account now or learn more about trading share CFDs with FXOpen.
This article represents the opinion of the Companies operating under the FXOpen brand only. It is not to be construed as an offer, solicitation, or recommendation with respect to products and services provided by the Companies operating under the FXOpen brand, nor is it to be considered financial advice.
Stay ahead of the market!
Subscribe now to our mailing list and receive the latest market news and insights delivered directly to your inbox.


Latest articles

CAD/JPY: The Yen's Most Historic Move in 30 Years Meets a Fragile Support
Two central banks are heading in genuinely opposite directions this week, and the tension is unmistakable. The Bank of Canada held rates steady at 2.25% on September 2, with a mildly hawkish tilt as policymakers acknowledged a broadening economic

USD/JPY and USD/CAD Await Key Fed Decision
The US dollar is consolidating against the yen and Canadian dollar ahead of the key event of the week — the Federal Reserve meeting. The Fed is widely expected to raise its policy rate by 25 basis points to a range

UnitedHealth: Fundamentals Are Healing, Now the Chart Must Agree
UnitedHealth finds itself in a genuinely split narrative right now, trading near $388, down about 15.9% from its 52-week high, even as the fundamental picture keeps improving. Q2 earnings beat expectations, with revenue of $112.03 billion, and the