


GBP/USD Analysis: The Rate Is Near October Highs
FXOpen

In early October, the GBP/USD decline exceeded 10% from its summer high, which was very worrying. However, the weakening of the US dollar and changes in sentiment in the US government bond market allowed the pound to strengthen.
Important news about UK GDP was published this morning:
→ The Office for National Statistics estimates that real gross domestic product (GDP) rose 0.2% in August 2023, after falling 0.6% in July 2023;
→ production of services grew by 0.4% in August 2023 and became the main driver of GDP growth;
→ the construction sector performed worse than others, falling 0.5% in August 2023 after falling 0.4% in July 2023.
In general, although the UK GDP picture gives reason for some optimism, the GBP/USD rate today reacted with a decline to the publication of this news. Perhaps influencing factors that are noticeable to technical analysis are coming into play?
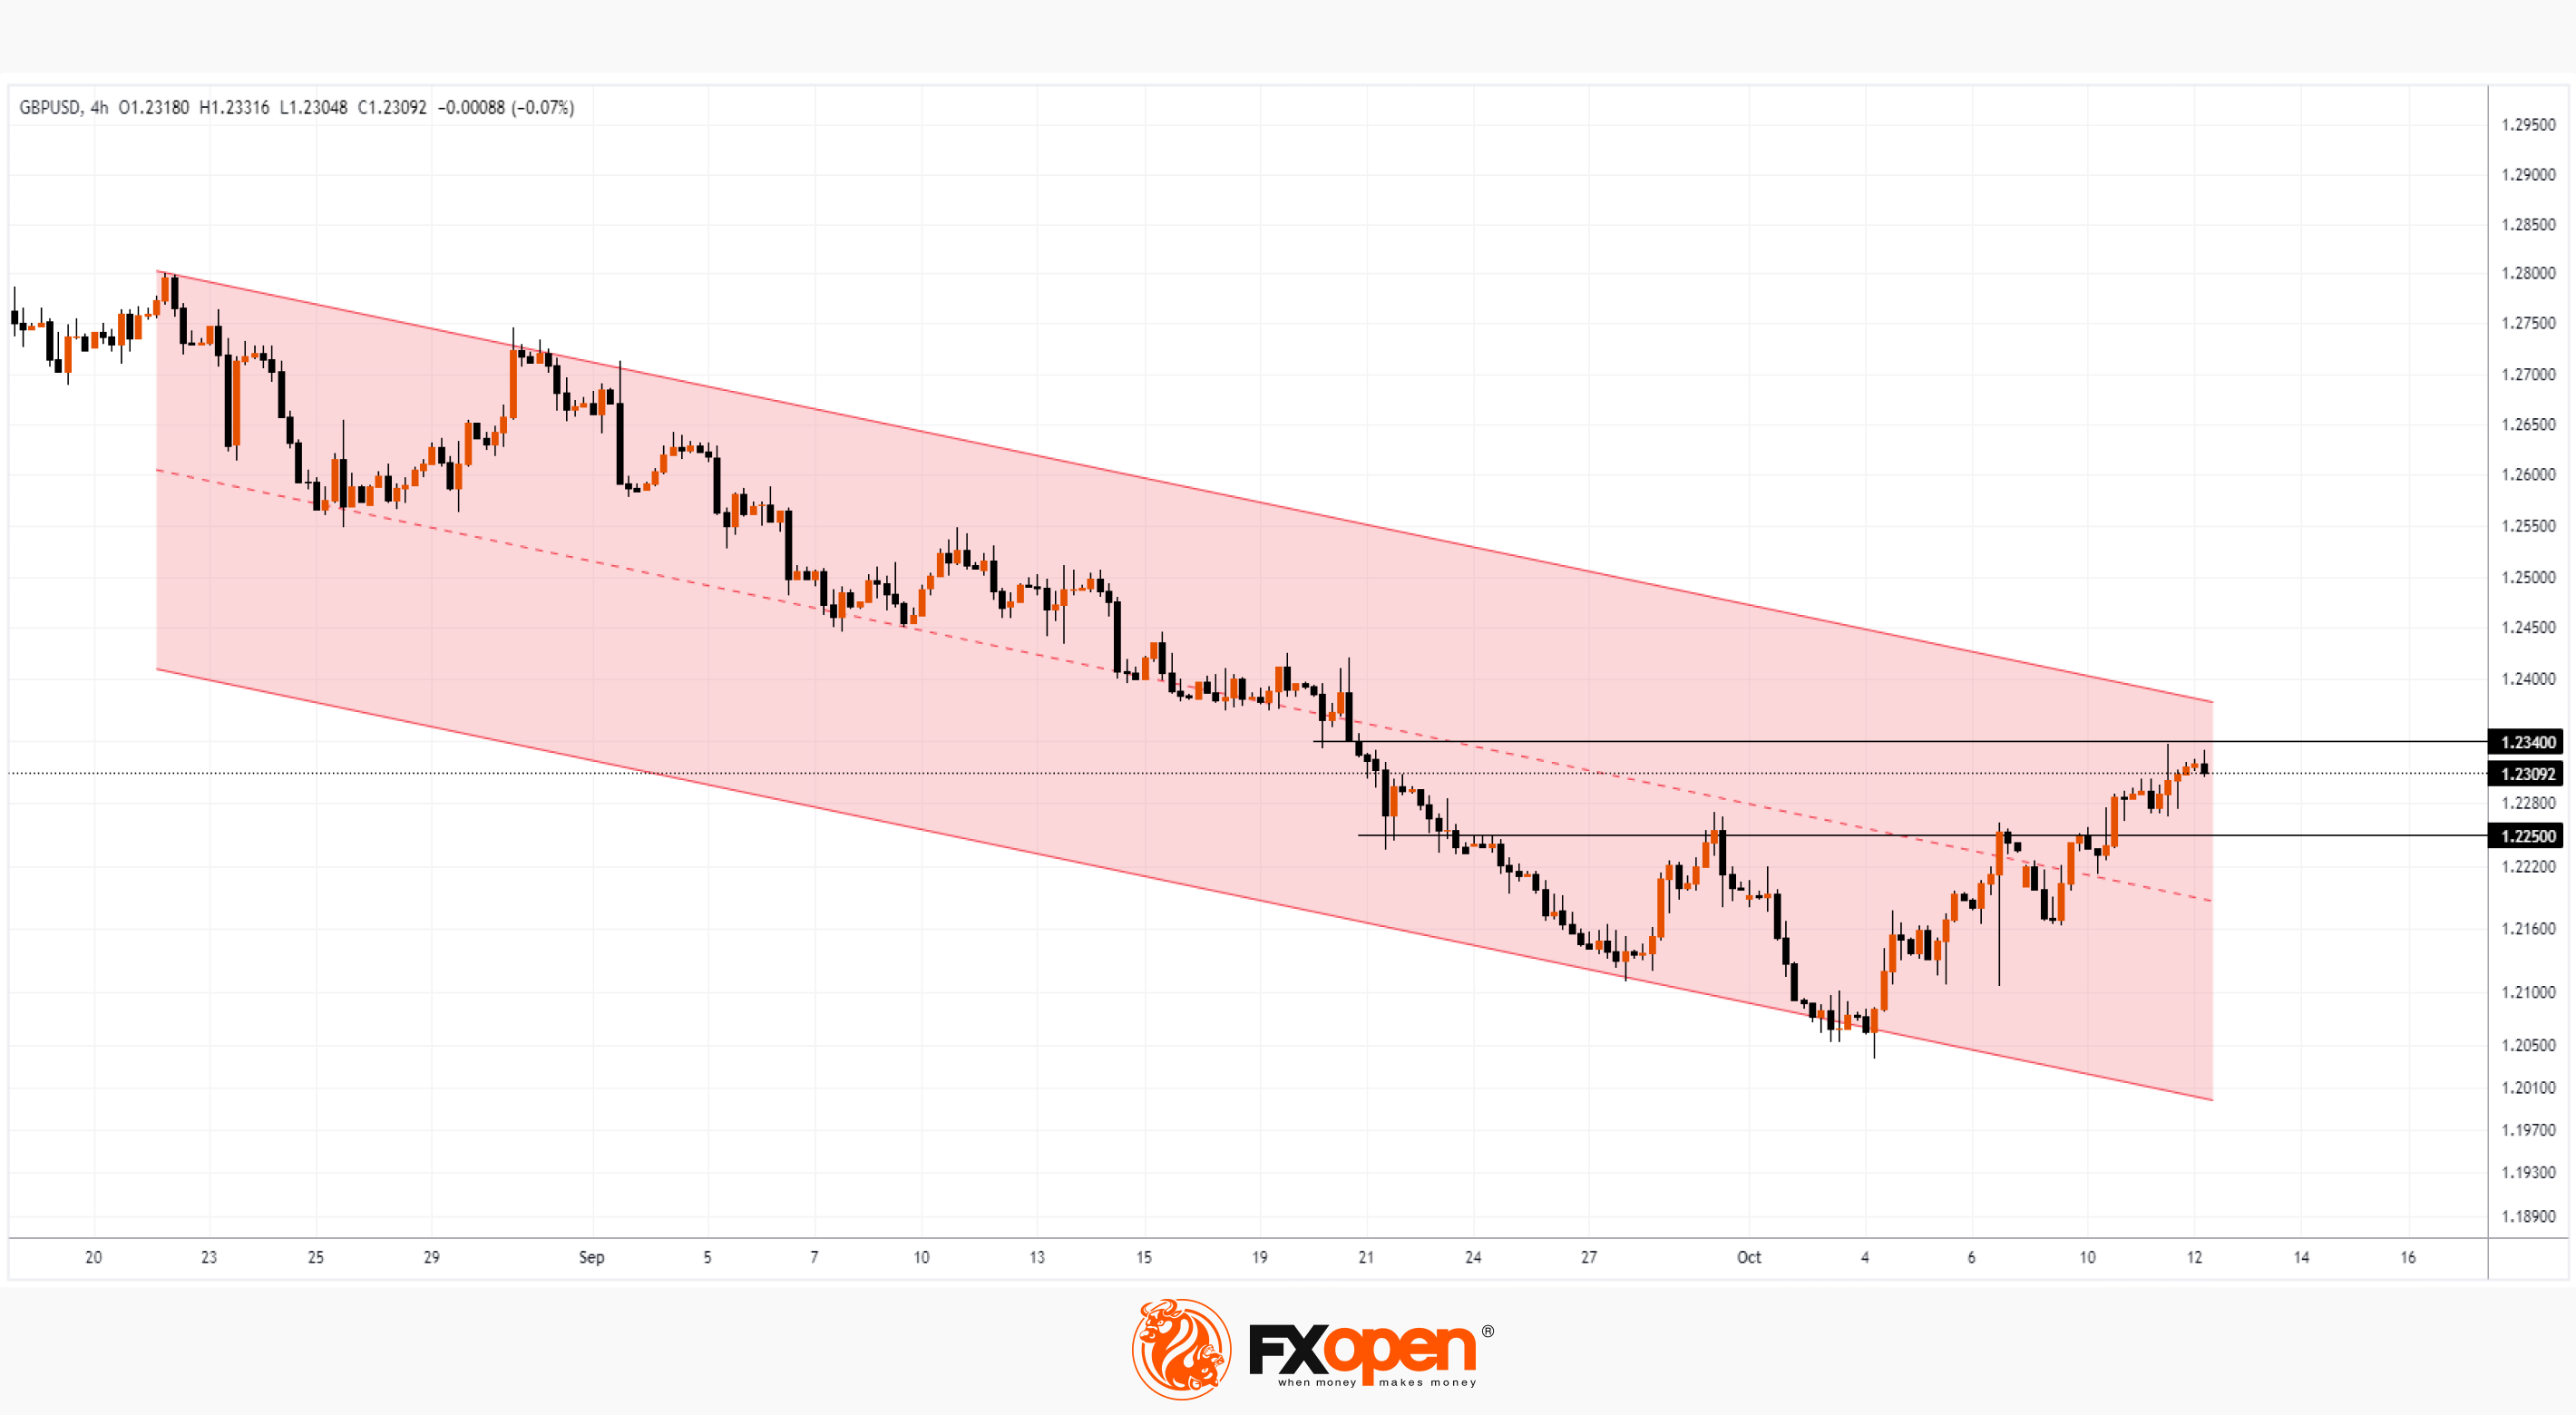
→ The GBP/USD rate rose to the level of 1.234. After breaking through it in the second half of September, the bears accelerated the decline, so the price may demonstrate that they have some control.
→ The GBP/USD rate rose to the upper border of the downward channel.
Bulls may hope that the 1.225 level (which served as resistance) will help them maintain the progress made in October. It is possible that if the forces of supply and demand balance each other, we will see exchange rate fluctuations between 1.234 and 1.225 in the coming days.
Trade over 50 forex markets 24 hours a day with FXOpen. Take advantage of low commissions, deep liquidity, and spreads from 0.0 pips (additional fees may apply). Open your FXOpen account now or learn more about trading forex with FXOpen.
This article represents the opinion of the Companies operating under the FXOpen brand only. It is not to be construed as an offer, solicitation, or recommendation with respect to products and services provided by the Companies operating under the FXOpen brand, nor is it to be considered financial advice.
Stay ahead of the market!
Subscribe now to our mailing list and receive the latest market news and insights delivered directly to your inbox.


Latest articles

AI Valuations Are Back in the Spotlight
Artificial intelligence remains the dominant investment theme of 2026, but investors are increasingly questioning whether AI stock valuations are keeping pace with reality.
💰 Big Tech continues to invest at an unprecedented scale, with hyperscaler AI spending projected to exceed $800

AUD/CAD: Months of Indecision — Is a Breakout Finally Coming?
The Australian dollar has clawed back most of its end-of-June losses, when it touched three-month lows against the greenback amid escalating Middle East tensions. Since then, sentiment has improved: the RBA's Assistant Governor Sarah Hunter signalled the board stands ready

USD/JPY: Battling at the Top of the Triangle
On 3 July, Japan's Finance Minister, Satsuki Katayama, stated that the Ministry of Finance remains in close contact with US authorities regarding developments in USD/JPY as the yen traded near its weakest level in almost 40 years. Similar verbal