


AUD/USD and NZD/USD Are Facing Many Hurdles
FXOpen

AUD/USD is following a bearish path and it recently settled below the key 0.6800 support area. NZD/USD is currently recovering, but it is facing many hurdles near 0.6300 and 0.6320.
Important Takeaways for AUD/USD and NZD/USD
- The Aussie Dollar is trading in a bearish zone and it recently tested the 0.6740 level against the US Dollar.
- There is a major bearish trend line forming with resistance near 0.6765 on the hourly chart of AUD/USD.
- NZD/USD is facing a strong resistance near the 0.6300 and 0.6320 levels.
- There is also a major breakout pattern forming with resistance near 0.6312 on the hourly chart.
AUD/USD Technical Analysis
In the past few days, the Aussie Dollar followed a bearish path from the 0.6850 resistance against the US Dollar. The AUD/USD pair broke many key supports near 0.6800 to enter a bearish zone.
The decline was such that the pair even broke the 0.6780 support and the 50 hourly simple moving average. A swing low was formed near 0.6740 on FXOpen and the pair is currently consolidating losses.
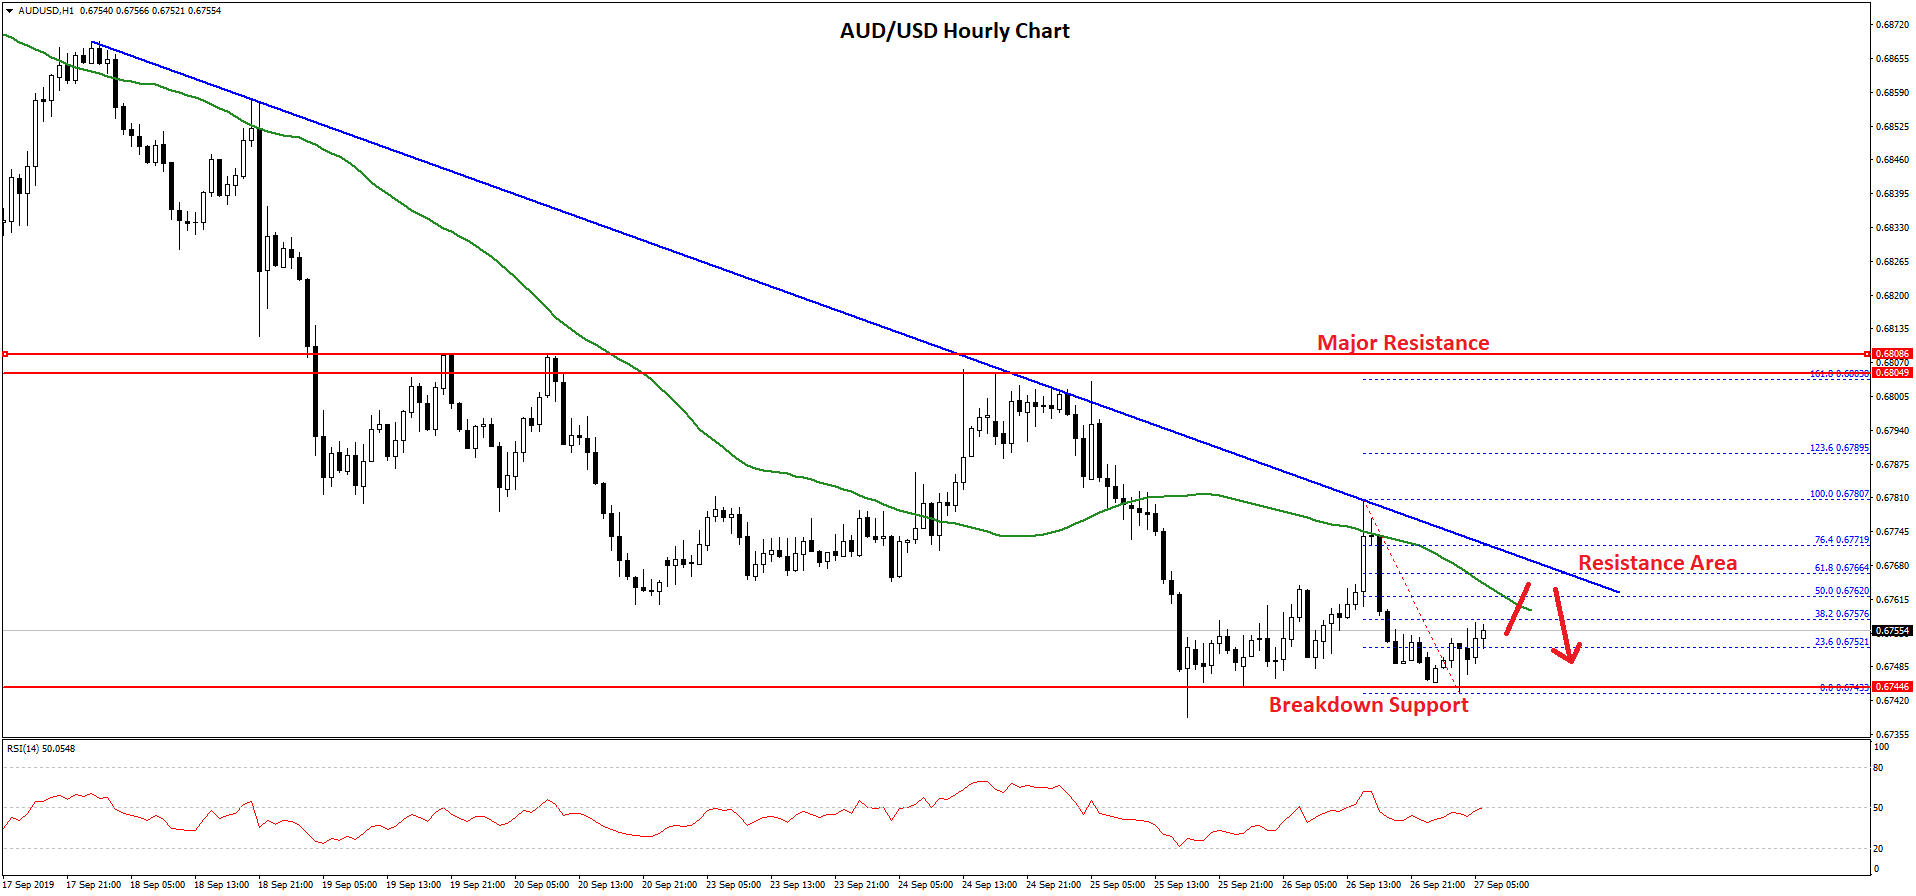
An immediate resistance is near the 0.6760 level and the 50 hourly simple moving average. Moreover, the 50% Fib retracement level of the recent decline from the 0.6780 high to 0.6743 low is also near the 0.6760 level.
More importantly, there is a major bearish trend line forming with resistance near 0.6765 on the hourly chart of AUD/USD. The trend line coincides with the 61.8% Fib retracement level of the recent decline from the 0.6780 high to 0.6743 low.
Therefore, an upside break above the trend line is needed for the pair to trade higher towards the 0.6780 and 0.6800 resistance levels. The main resistance is near 0.6800, above which the pair is likely to move into a positive zone.
On the downside, an immediate support is near the 0.6740 level. If the pair breaks the 0.6740 support, there is a risk of more downsides towards the 0.6700 level.
NZD/USD Technical Analysis
The New Zealand Dollar struggled to stay above the 0.6350 level and recently declined against the US Dollar. The NZD/USD pair broke the key 0.6300 support level to enter a bearish zone.
The pair even settled below the 0.6300 level and the 50 hourly simple moving average. The recent swing low was formed near 0.6282 and the pair is currently correcting higher.
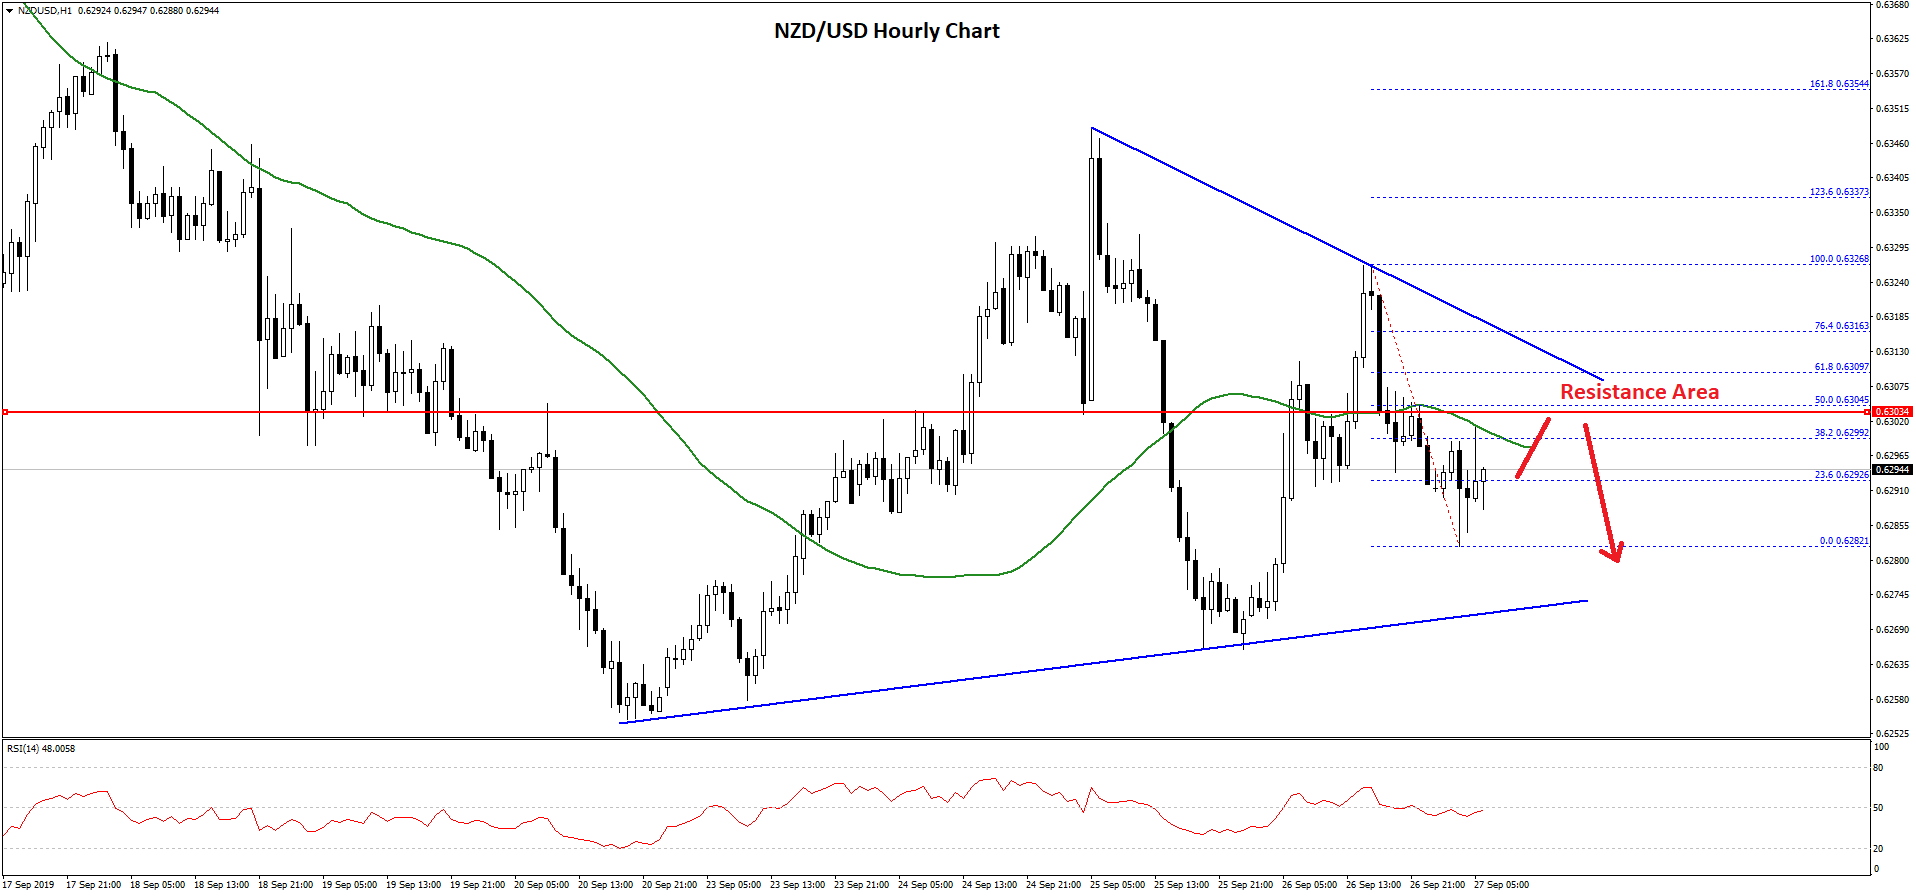
It is currently facing a strong resistance near the 0.6300 level and the 50 hourly simple moving average. Moreover, the 38.2% Fib retracement level of the recent drop from the 0.6326 high to 0.6282 low is also acting as a resistance.
More importantly, there is a major breakout pattern forming with resistance near 0.6312 on the hourly chart. The main resistances are near 0.6300, 0.6305, 0.6312, and the 61.8% Fib retracement level of the recent drop from the 0.6326 high to 0.6282 low.
Therefore, the pair needs to surpass the 0.6300 and 0.6320 resistance levels to continue higher in the near term. The next key resistance is near 0.6350, above which it could revisit the 0.6400 level.
Conversely, if there is no upside break above 0.6320, the NZD/USD pair decline again. An immediate support is near the 0.6280 level, below which there is a risk of a downside extension towards the 0.6250 level.
Trade over 50 forex markets 24 hours a day with FXOpen. Take advantage of low commissions, deep liquidity, and spreads from 0.0 pips (additional fees may apply). Open your FXOpen account now or learn more about trading forex with FXOpen.
This article represents the opinion of the Companies operating under the FXOpen brand only. It is not to be construed as an offer, solicitation, or recommendation with respect to products and services provided by the Companies operating under the FXOpen brand, nor is it to be considered financial advice.
Stay ahead of the market!
Subscribe now to our mailing list and receive the latest market news and insights delivered directly to your inbox.


Latest articles

Weekly Market Insights with Gary Thomson: The Week of Central Banks and Earnings
In this video, we’ll explore the key economic events and market trends, shaping the financial landscape. Get ready for insights into financial markets to help you navigate the week ahead. Let’s dive in!
In this episode of Market

Intel at a Crossroads: Earnings Beat Meets Technical Resistance
Intel has just delivered its strongest quarter in over fifteen years, and the market reaction says it all. Q2 2026 revenue surged 25% year-over-year to $16.1 billion, crushing the consensus estimate of $14.42 billion, while adjusted EPS of

Tesla: Complex Range Structure Breaks Down Following Quarterly Earnings
Tesla released its Q2 2026 results after the market closed on 22 July. Revenue increased 26% year-on-year to $28.24 billion, while vehicle deliveries reached a record 480,126 units. However, operating margin fell sharply to 1.4%, down from