


AUD/USD and NZD/USD At Risk Of More Downsides August 2019
FXOpen

AUD/USD failed to climb above the key 0.6800 resistance and declined recently. Similarly, NZD/USD is struggling to recover and facing a strong resistance near the 0.6400 area.
Important Takeaways for AUD/USD and NZD/USD
- The Aussie Dollar is trading well below the key 0.6800 resistance area against the US Dollar.
- There was a break below a major bullish trend line with support near 0.6760 on the hourly chart of AUD/USD.
- NZD/USD is currently correcting higher, but facing a strong resistance near the 0.6400 area.
- There is also a crucial bearish trend line forming with resistance near 0.6405 on the hourly chart.
AUD/USD Technical Analysis
In the past few days, the Aussie Dollar remained in a broad range below the 0.6800 resistance against the US Dollar. The AUD/USD pair made a few attempts to surpass the 0.6790 and 0.6800 resistance levels, but the bulls failed to gain momentum.
As a result, there was a bearish reaction recently below the 0.6780 support after the last swing high was formed near 0.6799 on FXOpen. The pair declined below the 0.6765 support and the 50 hourly simple moving average.
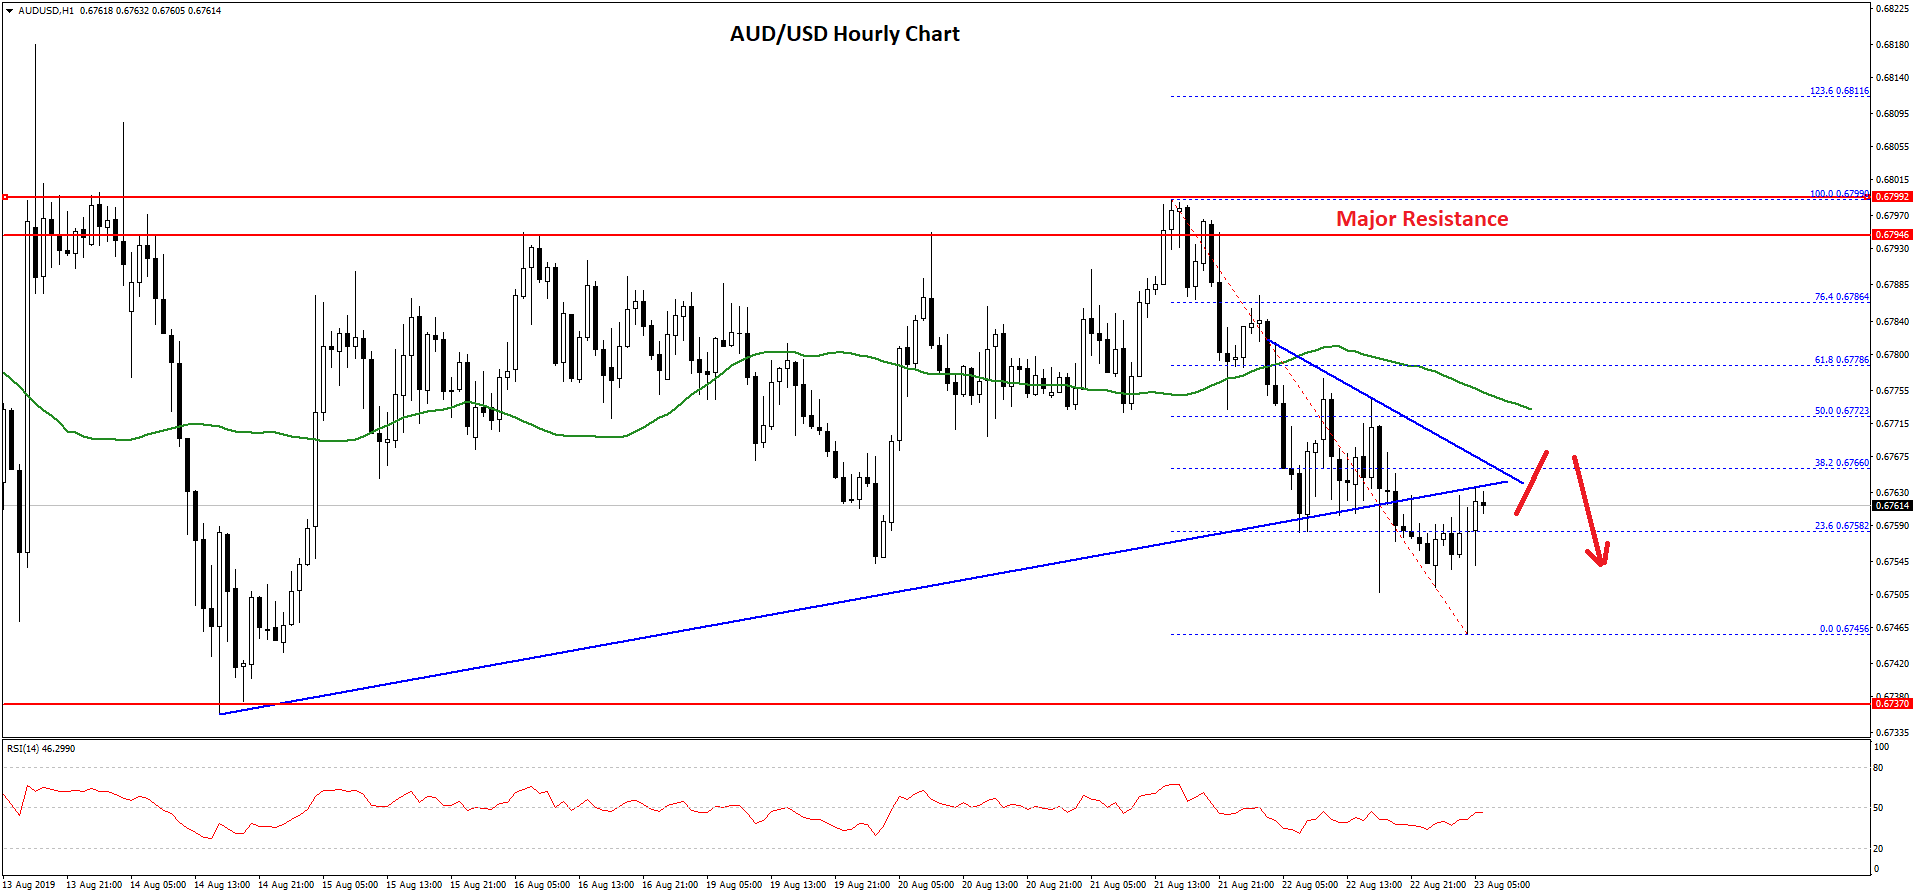
Moreover, there was a break below a major bullish trend line with support near 0.6760 on the hourly chart of AUD/USD. The pair even spiked below 0.6750 and traded as low as 0.6745.
At the moment, the pair is correcting higher above the 0.6750 level. There was a break above the 23.6% Fib retracement level of the recent decline from the 0.6799 high to 0.6745 low.
However, the previous trend line and support near the 0.6765 is now acting as a strong resistance. There is also a connecting bearish trend line forming on the same chart with resistance near the 0.6772.
Therefore, to continue higher, the pair needs to climb above 0.6765, the 50 hourly simple moving average, and 0.6775. The main resistance is still 0.6800, above which the pair could rally towards the 0.6840 resistance level.
On the downside, an immediate support is near the 0.6750 level. If the pair breaks the 0.6750 support, there is a risk of a downside extension towards the 0.6735 level.
NZD/USD Technical Analysis
The New Zealand Dollar started a major decline from well above the 0.6450 level against the US Dollar. The NZD/USD pair broke the key 0.6400 support level to enter a bearish zone.
Moreover, there was a close below 0.6400 and the 50 hourly simple moving average. Finally, the pair declined towards the 0.6360 level and a swing low was formed near the 0.6361 level.
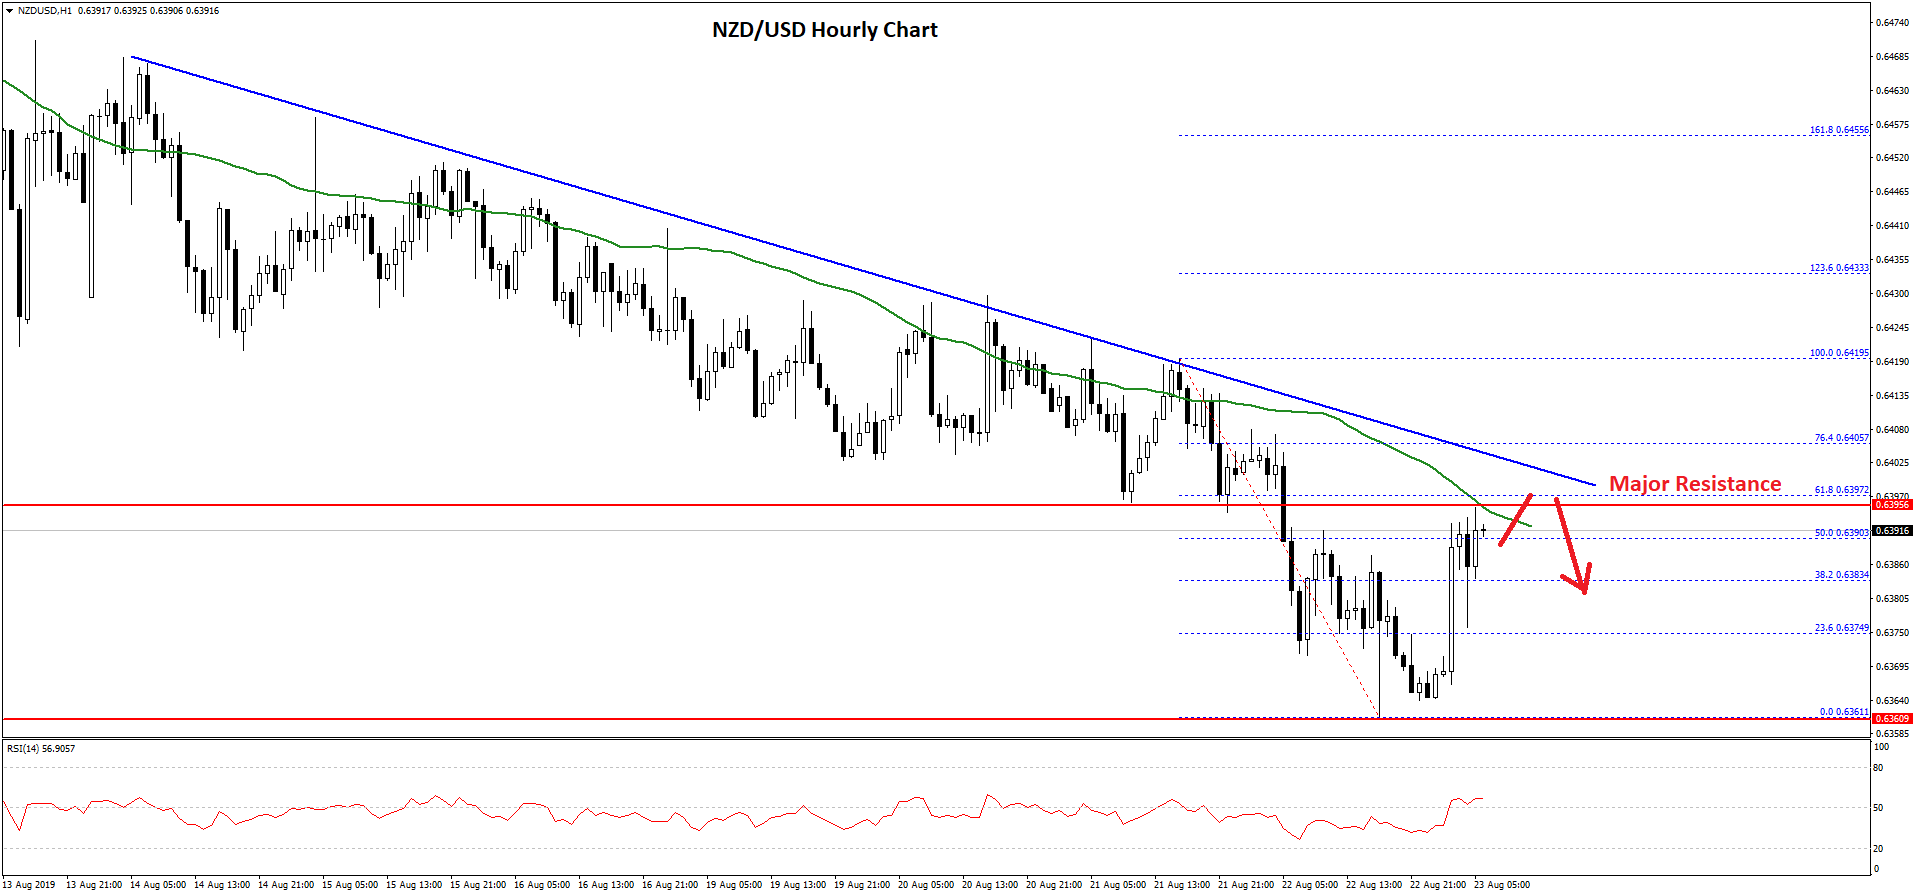
At the moment, the pair is correcting higher above 0.6380 level plus the 23.6% Fib retracement level of the recent decline from the 0.6419 high to 0.6361 low. However, there is a strong resistance forming near the 0.6395 level and the 50 hourly simple moving average.
Additionally, there is also a crucial bearish trend line forming with resistance near 0.6405 on the hourly chart. The 50% Fib retracement level of the recent decline from the 0.6419 high to 0.6361 low is also acting as a strong barrier.
Therefore, the pair needs to settle above the 0.6400 resistance and the 50 hourly SMA to continue higher in the near term. The next key resistance above 0.6400 is near the 0.6440 level.
Conversely, if there is no upside break above 0.6400, the NZD/USD pair could resume its decline. The main supports on the downside are near 0.6380 and 0.6360.
Trade over 50 forex markets 24 hours a day with FXOpen. Take advantage of low commissions, deep liquidity, and spreads from 0.0 pips (additional fees may apply). Open your FXOpen account now or learn more about trading forex with FXOpen.
This article represents the opinion of the Companies operating under the FXOpen brand only. It is not to be construed as an offer, solicitation, or recommendation with respect to products and services provided by the Companies operating under the FXOpen brand, nor is it to be considered financial advice.
Stay ahead of the market!
Subscribe now to our mailing list and receive the latest market news and insights delivered directly to your inbox.


Latest articles

DAX 40: consolidation amid technology sell-off
A wave of selling in the technology sector that emerged earlier this week has weighed on European equities. The trigger was investor concern over the profitability of large-scale debt-funded investments by major US tech companies in AI infrastructure. The Nasdaq

Euro Hits Fresh Yearly Lows Amid Dovish ECB Signals
The euro remains under pressure following weak macroeconomic data from the euro area and fresh signals that the European Central Bank is prepared to maintain a more accommodative monetary policy stance. Data released yesterday pointed to a deterioration in business

Pound at Key Levels: Markets Assess Impact of Political Uncertainty in the UK
The British pound remains under pressure following increased political uncertainty in the United Kingdom triggered by the Prime Minister’s resignation. Investors are assessing potential shifts in the political and economic policy outlook after the head of government stepped down,