


AUD/USD and NZD/USD At Risk of More Downsides
FXOpen
AUD/USD started a fresh decline from well above the 0.7500 zone. NZD/USD accelerated lower and it is now consolidating near the 0.7080 zone.
Important Takeaways for AUD/USD and NZD/USD
· The Aussie Dollar started a fresh decline from well above 0.7500 against the US Dollar.
· There is a key bearish trend line forming with resistance near 0.7470 on the hourly chart of AUD/USD.
· NZD/USD also declined after it failed to clear the 0.7200 resistance.
· There is a major bearish trend line forming with resistance near 0.7160 on the hourly chart of NZD/USD.
AUD/USD Technical Analysis
The Aussie Dollar failed to stay above 0.7500 and started a major decline against the US Dollar. The AUD/USD pair broke the 0.7450 and 0.7420 support levels to move into a bearish zone.
The pair even broke the 0.7400 support level and the 50 hourly simple moving average. The pair traded as low as 0.7378 on FXOpen and it is now consolidating losses. An immediate resistance is near the 0.7400 level.
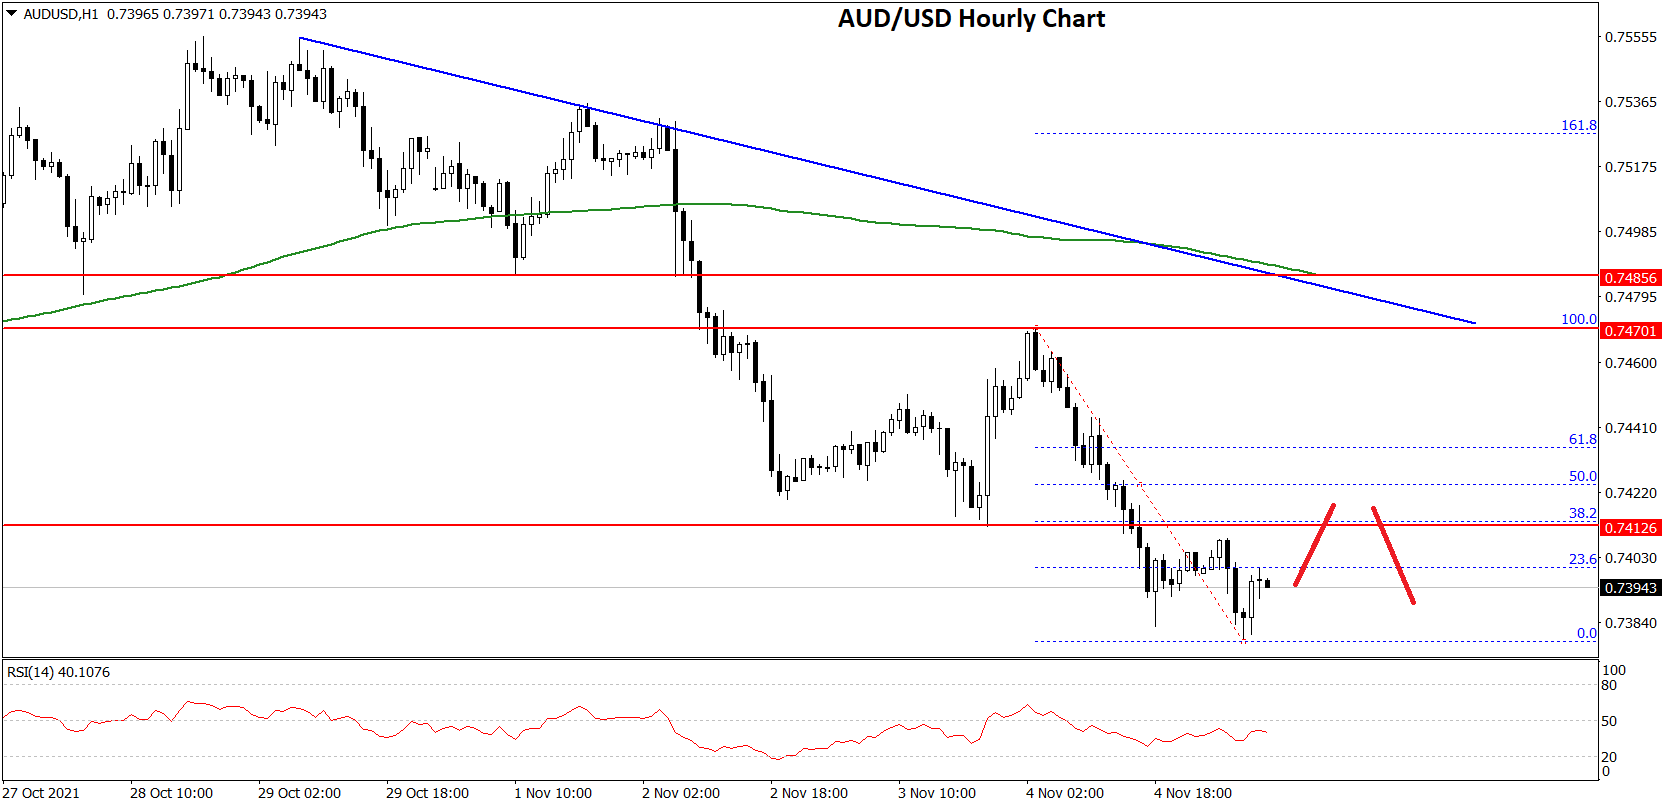
It is near the 23.6% Fib retracement level of the downward move from the 0.7470 swing high to 0.7378 low. The next major resistance is near the 0.7420 level.
The 50% Fib retracement level of the downward move from the 0.7470 swing high to 0.7378 low is also near the 0.7420 level. A close above the 0.7420 level could start a steady increase in the near term. The next major resistance could be 0.7450.
An initial support on the downside is near the 0.7380 level. The next major support is near the 0.7350 level. If there is a downside break below the 0.7350 support, the pair could extend its decline towards the 0.7320 level. The next major support is near 0.7300, below which the pair could accelerate lower in the near term.
NZD/USD Technical Analysis
The New Zealand Dollar also started a major decline from well above 0.7150 against the US Dollar. The NZD/USD pair declined below the 0.7120 level to move into a bearish zone.
The pair settled below 0.7100 and the 50 hourly simple moving average. A low is formed near 0.7080 and it is now consolidating losses. On the upside, the bulls are facing hurdles near 0.7100.
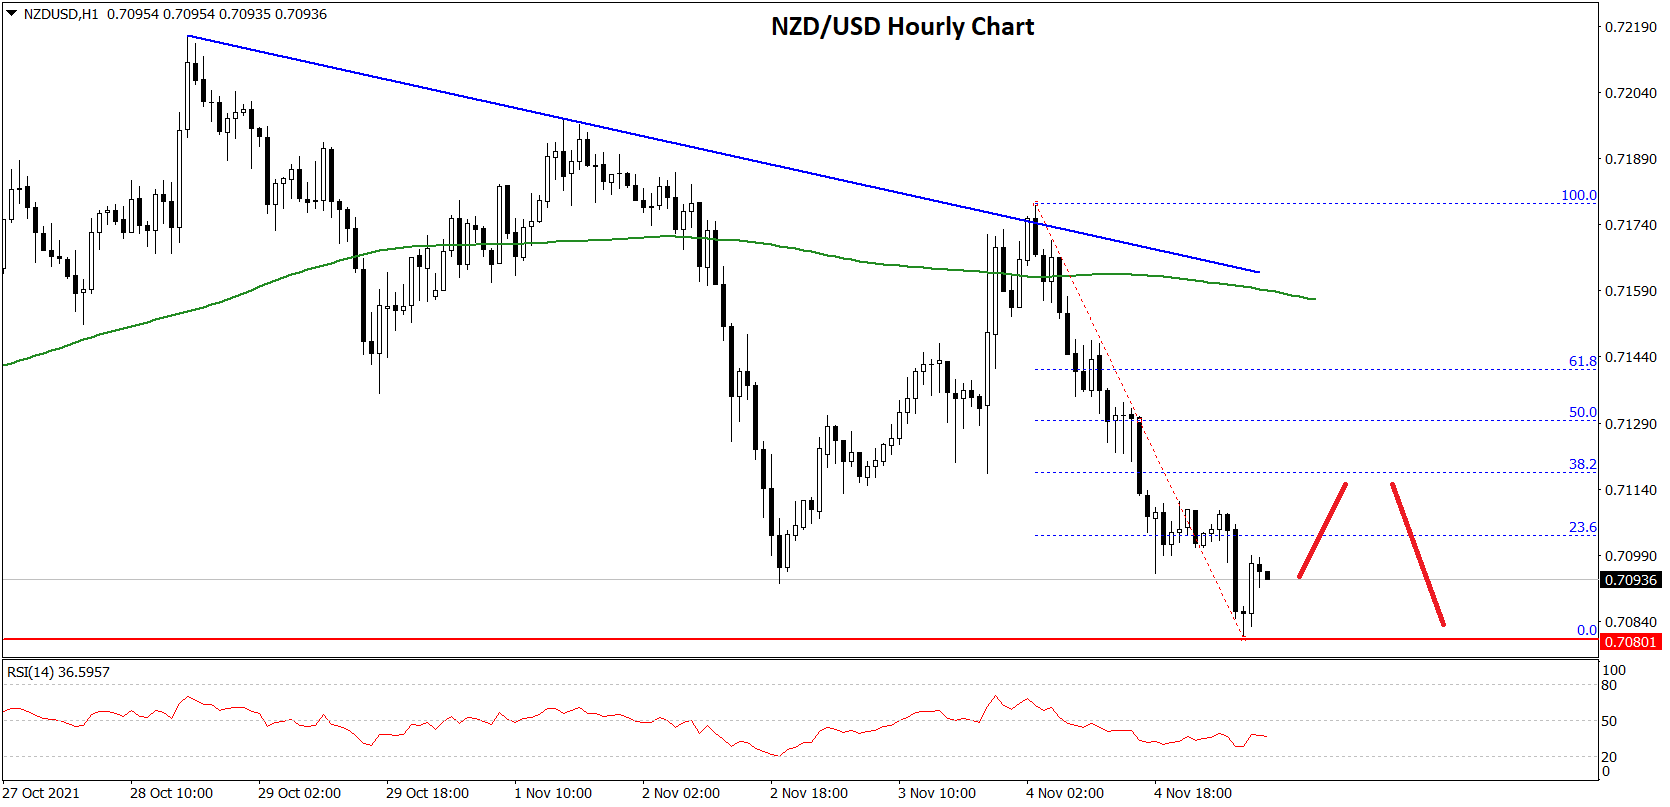
It is near the 23.6% Fib retracement level of the downward move from the 0.7178 swing high to 0.7080 low. The next major resistance is near the 0.7130 level, where the bears might emerge.
The 50% Fib retracement level of the downward move from the 0.7178 swing high to 0.7080 low is also near the 0.7130 level. Besides, there is a major bearish trend line forming with resistance near 0.7160 on the hourly chart of NZD/USD.
A close above the 0.7150 level could start a steady increase in the near term. The next major stop for the bulls could be 0.7200.
An immediate support is near the 0.7080 level. The next major support is near 0.7050. If there is a downside break below the 0.7050 support, the pair could extend its decline towards the 0.7020 level. The next key support may be near the 0.7000 zone, where the bulls might take a stand.
This forecast represents FXOpen Markets Limited opinion only, it should not be construed as an offer, invitation or recommendation in respect to FXOpen Markets Limited products and services or as financial advice.
This article represents the opinion of the Companies operating under the FXOpen brand only. It is not to be construed as an offer, solicitation, or recommendation with respect to products and services provided by the Companies operating under the FXOpen brand, nor is it to be considered financial advice.
Stay ahead of the market!
Subscribe now to our mailing list and receive the latest market news and insights delivered directly to your inbox.

Latest articles

WTI Analysis: Gap Breaks Short-Term Trend as Price Remains Trapped Between the POC and Profile Boundary
WTI crude oil plunged by more than 7% on 27 July 2026 after the US suspended a series of strikes against Iran over the weekend, raising hopes of a diplomatic solution and the reopening of shipping through the Strait of

US Dollar Index: A Defining Week for the King of the Markets
The dollar heads into a pivotal week trading near 101.80, just off a 15-month high, with the Fed's July 29 meeting standing as the clear focal point. Markets currently price roughly a 65% chance of a hold, though renewed

NZD/USD: Inflation Surge Meets Strong US Dollar Pressure
On 21 July, Stats NZ reported an acceleration in inflation: the Consumer Price Index rose 1.5% in the second quarter, while the annual inflation rate climbed to 4.1%, its highest level in more than two years and slightly