


AUD/USD and NZD/USD At Risk of More Downsides
FXOpen
AUD/USD is under pressure below the 0.7100 support. Similarly, NZD/USD is at risk of more losses below the 0.6470 support level. Upsides are likely to be capped in the short term in both pairs.
Important Takeaways for AUD/USD and NZD/USD
- The Aussie Dollar broke the key 0.7170 support and declined sharply against the US Dollar.
- There is a major bearish trend line in place with resistance at 0.7090 on the hourly chart of AUD/USD.
- NZD/USD could break down below the 0.6470 and 0.6450 support levels.
- There is a key bearish trend line formed with resistance at 0.6485 on the hourly chart.
AUD/USD Technical Analysis
The Aussie Dollar failed to gain traction above the 0.7250 level and declined sharply against the US Dollar. The AUD/USD pair broke the 0.7170 and 0.7150 support levels to move into a bearish zone.
The decline was such that the pair even surpassed the 0.7100 support and settled below the 50 hourly simple moving average. It traded as low as 0.7065 and later started consolidating in a tiny range.
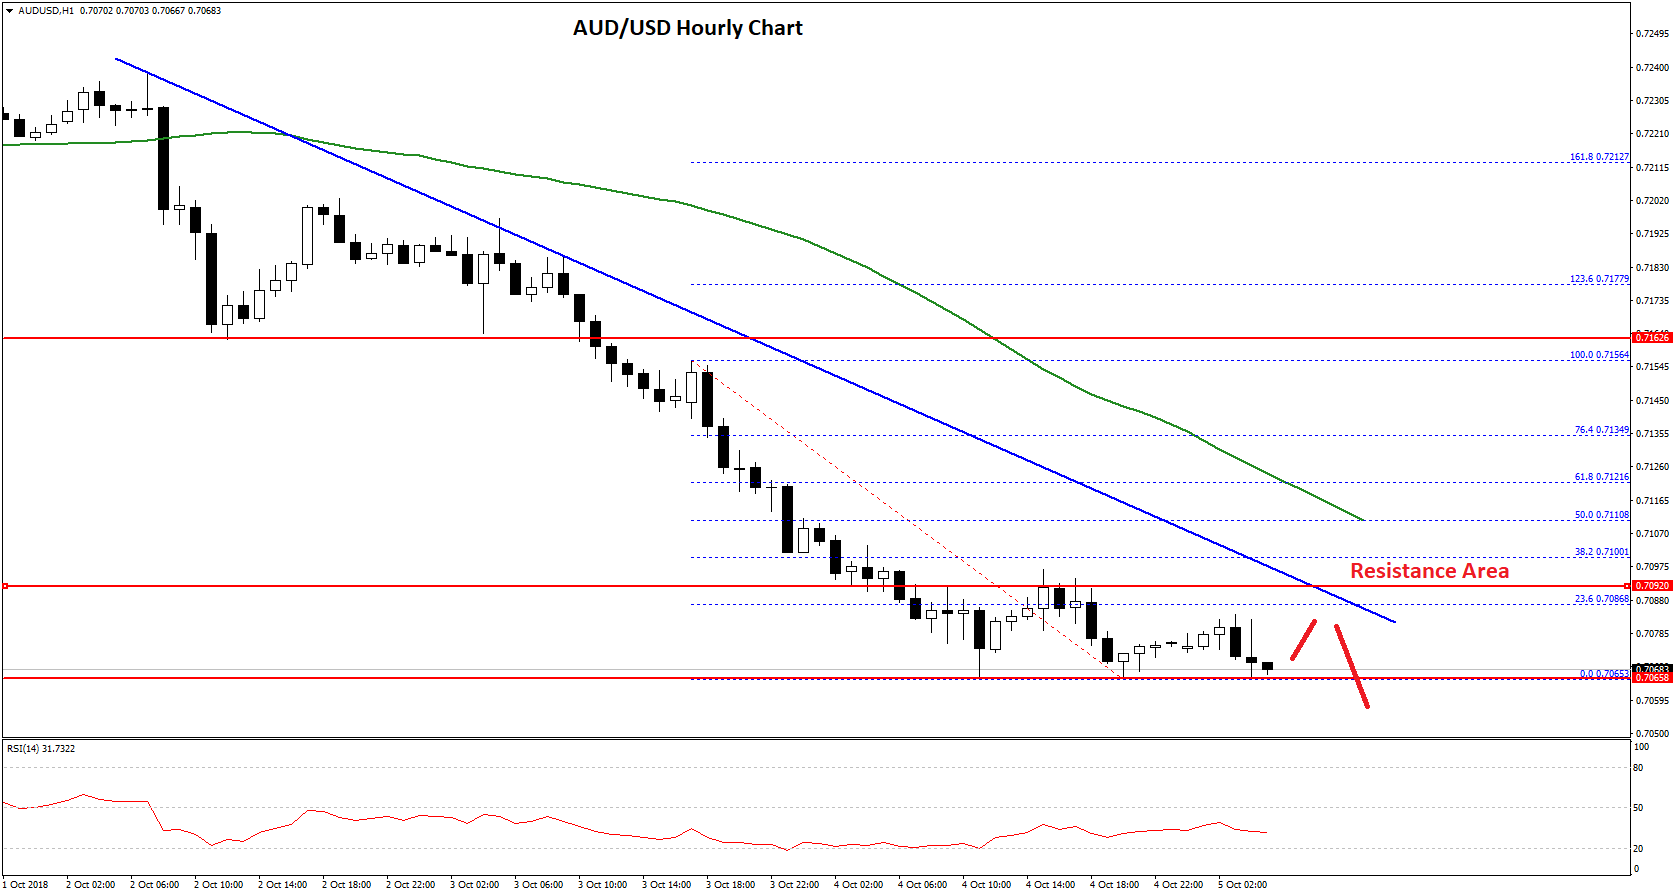
It seems like the pair is struggling to break the 23.6% Fib retracement level of the recent decline from the 0.7156 high to 0.7065 low. More importantly, there is a major bearish trend line in place with resistance at 0.7090 on the hourly chart.
Above the trend line resistance, there is a key resistance formed near the 0.7110 level and the 50 hourly SMA. It also coincides with the 50% Fib retracement level of the recent decline from the 0.7156 high to 0.7065 low.
Therefore, if the pair corrects higher, it is likely to face a strong resistance near the 0.7100-0.7110 zone. A close above the mentioned resistance could open the doors for a larger correction towards the 0.7150 level.
On the downside, there could be heavy declines if sellers push the pair below the 0.7065 low. The next major support is at 0.7020 followed by the all-important 0.7000 handle.
NZD/USD Technical Analysis
The New Zealand Dollar also followed a similar pattern and started a downside move from the 0.6620 swing high against the US Dollar. The NZD/USD pair broke the 0.6575 support level to move into a bearish zone.
During the decline, the pair also broke the 0.6550 and 0.6500 support levels and traded as low as 0.6470 recently. It seems like the pair is under a lot of pressure below the 0.6500 level. An initial resistance is near the 23.6% Fib retracement level of the recent decline from the 0.6509 high to 0.6470 low.
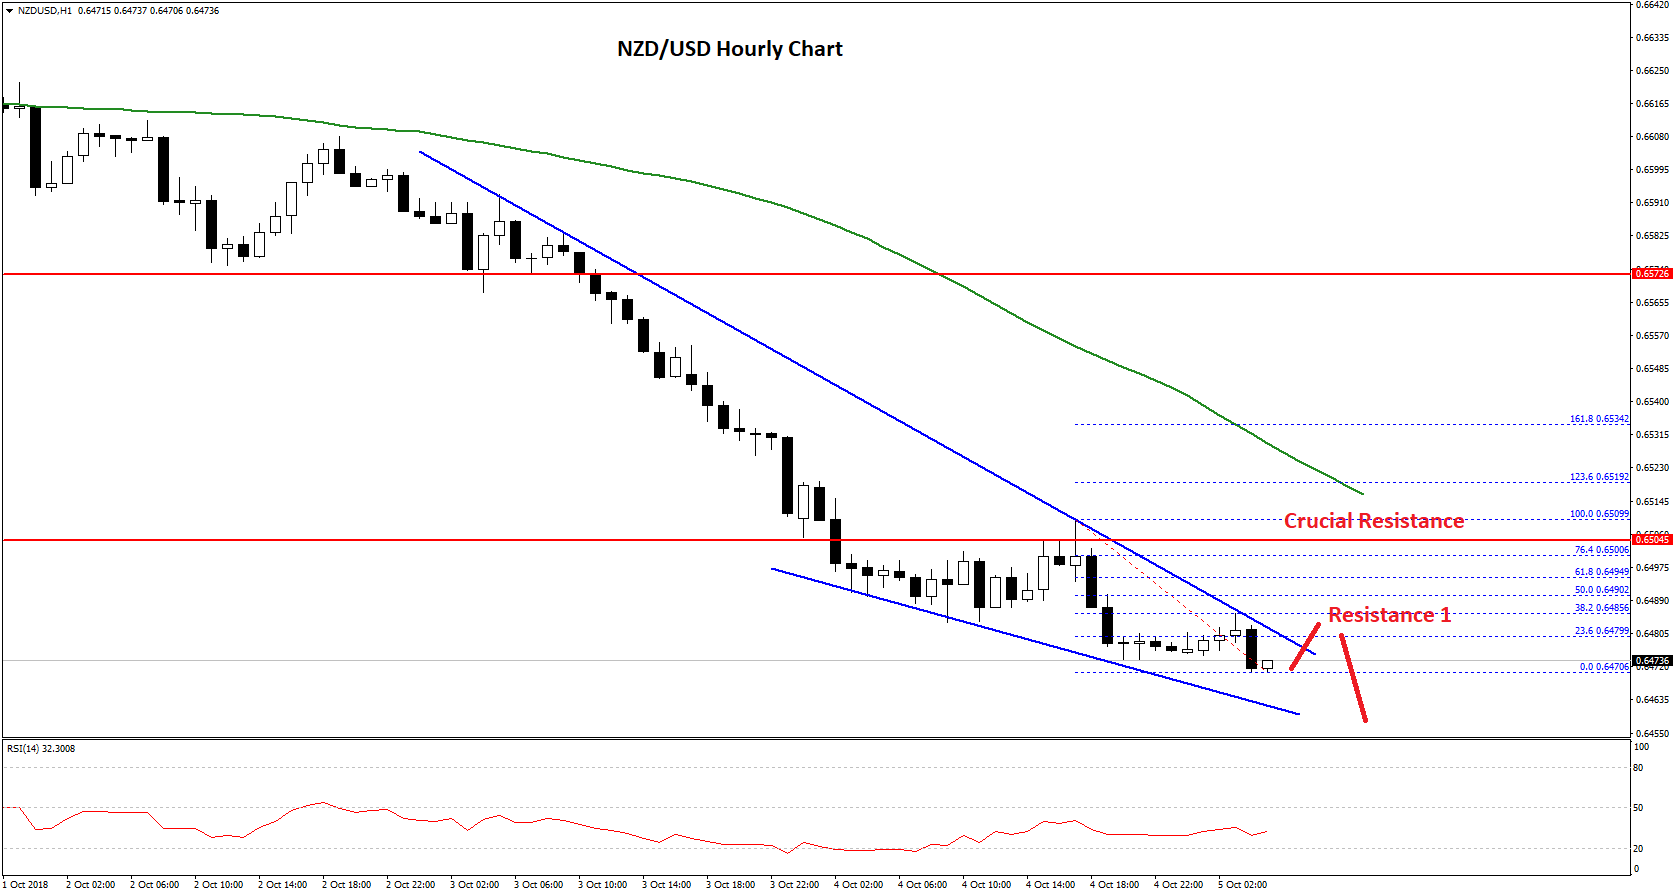
Moreover, there is a key bearish trend line formed with resistance at 0.6485 on the hourly chart. A push above the trend line may well take the pair towards the 0.6500 resistance.
An intermediate resistance is near 0.6490 and the 50% Fib retracement level of the recent decline from the 0.6509 high to 0.6470 low. Above 0.6490 and 0.6500, the next crucial resistance for the current downtrend is at 0.6520 and the 50 hourly simple moving average.
Therefore, if the pair corrects higher, it is likely to face a lot of sellers near the 0.6500 and 0.6520 levels. On the downside, a break below the 0.6470 low may perhaps open the doors for more downsides. The next major supports below 0.6470 are at 0.6450 and 0.6420.
Trade over 50 forex markets 24 hours a day with FXOpen. Take advantage of low commissions, deep liquidity, and spreads from 0.0 pips (additional fees may apply). Open your FXOpen account now or learn more about trading forex with FXOpen.
This article represents the opinion of the Companies operating under the FXOpen brand only. It is not to be construed as an offer, solicitation, or recommendation with respect to products and services provided by the Companies operating under the FXOpen brand, nor is it to be considered financial advice.
Stay ahead of the market!
Subscribe now to our mailing list and receive the latest market news and insights delivered directly to your inbox.


Latest articles

Amazon Earnings: Does the Chart Already Know Something the Numbers Don't?
All eyes are on July 30, when Amazon reports Q2 2026 earnings, with Wall Street increasingly convinced the bar has been set too low. Consensus sees EPS near $1.82-$2.26 on roughly $197 billion in revenue, but the

WTI Analysis: Gap Breaks Short-Term Trend as Price Remains Trapped Between the POC and Profile Boundary
WTI crude oil plunged by more than 7% on 27 July 2026 after the US suspended a series of strikes against Iran over the weekend, raising hopes of a diplomatic solution and the reopening of shipping through the Strait of

US Dollar Index: A Defining Week for the King of the Markets
The dollar heads into a pivotal week trading near 101.80, just off a 15-month high, with the Fed's July 29 meeting standing as the clear focal point. Markets currently price roughly a 65% chance of a hold, though renewed