


AUD/USD and NZD/USD Climbing Steadily
FXOpen

AUD/USD started a decent upward move and broke the key 0.6880 resistance area. NZD/USD is also moving higher and likely to continue its upward move towards the 0.6460 level.
Important Takeaways for AUD/USD and NZD/USD
- The Aussie Dollar is trading nicely above the 0.6850 and 0.6880 support levels against the US Dollar.
- There is a key bullish trend line forming with support near 0.6890 on the hourly chart of AUD/USD.
- NZD/USD is gaining momentum and it is trading nicely above the 0.6420 support.
- There was a break above a key contracting triangle with resistance near 0.6430 on the hourly chart of NZD/USD.
AUD/USD Technical Analysis
This week, the Aussie Dollar started a strong upward move from the 0.6820 support area against the US Dollar. The AUD/USD pair broke a couple of important hurdles near 0.6850 to move into a positive zone.
The upward move was such that the pair even climbed above the 0.6880 resistance area and the 50 hourly simple moving average. Finally, the pair traded above the 0.6900 level and formed a new weekly high near the 0.6929 level.
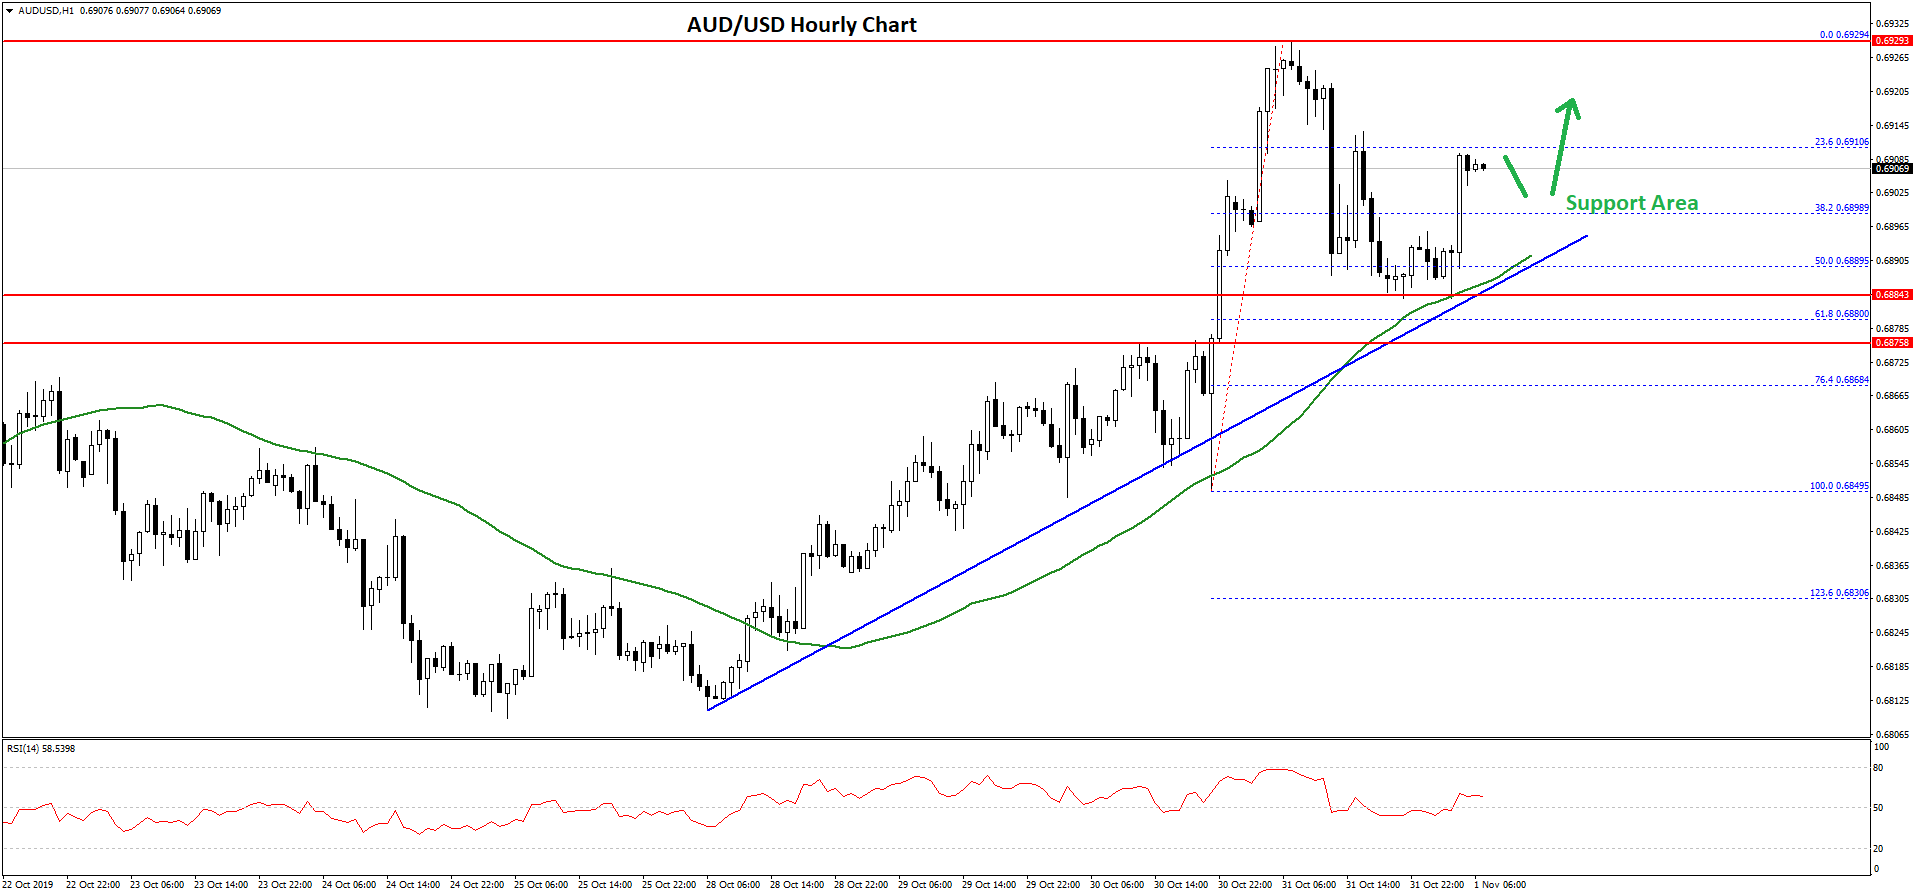
Recently, there was a downside correction below the 0.6900 support area. The pair even traded below the 38.2% Fib retracement level of the recent leg from the 0.6849 low to 0.6929 high.
However, the 0.6880 support area is currently acting as a strong support. Furthermore, the 50% Fib retracement level of the recent leg from the 0.6849 low to 0.6929 high is protecting losses.
More importantly, there is a key bullish trend line forming with support near 0.6890 on the hourly chart of AUD/USD. Therefore, there are high chances of a fresh increase above the 0.6920 resistance area in the coming sessions.
On the downside, the main support is near the 0.6880 area. If there is a clear break below the 0.6880 support, there is a risk of an extended correction towards the 0.6850 level. The next major support below 0.6850 is near the 0.6830 level.
NZD/USD Technical Analysis
The New Zealand Dollar also followed a similar increase from the 0.6350 support area against the US Dollar. The NZD/USD pair climbed above the 0.6340 and 0.6350 resistance levels to start a strong upward move.
The upward move gained pace above the 0.6380 resistance and the 50 hourly simple moving average. It opened the doors for more gains above the 0.6400 resistance.
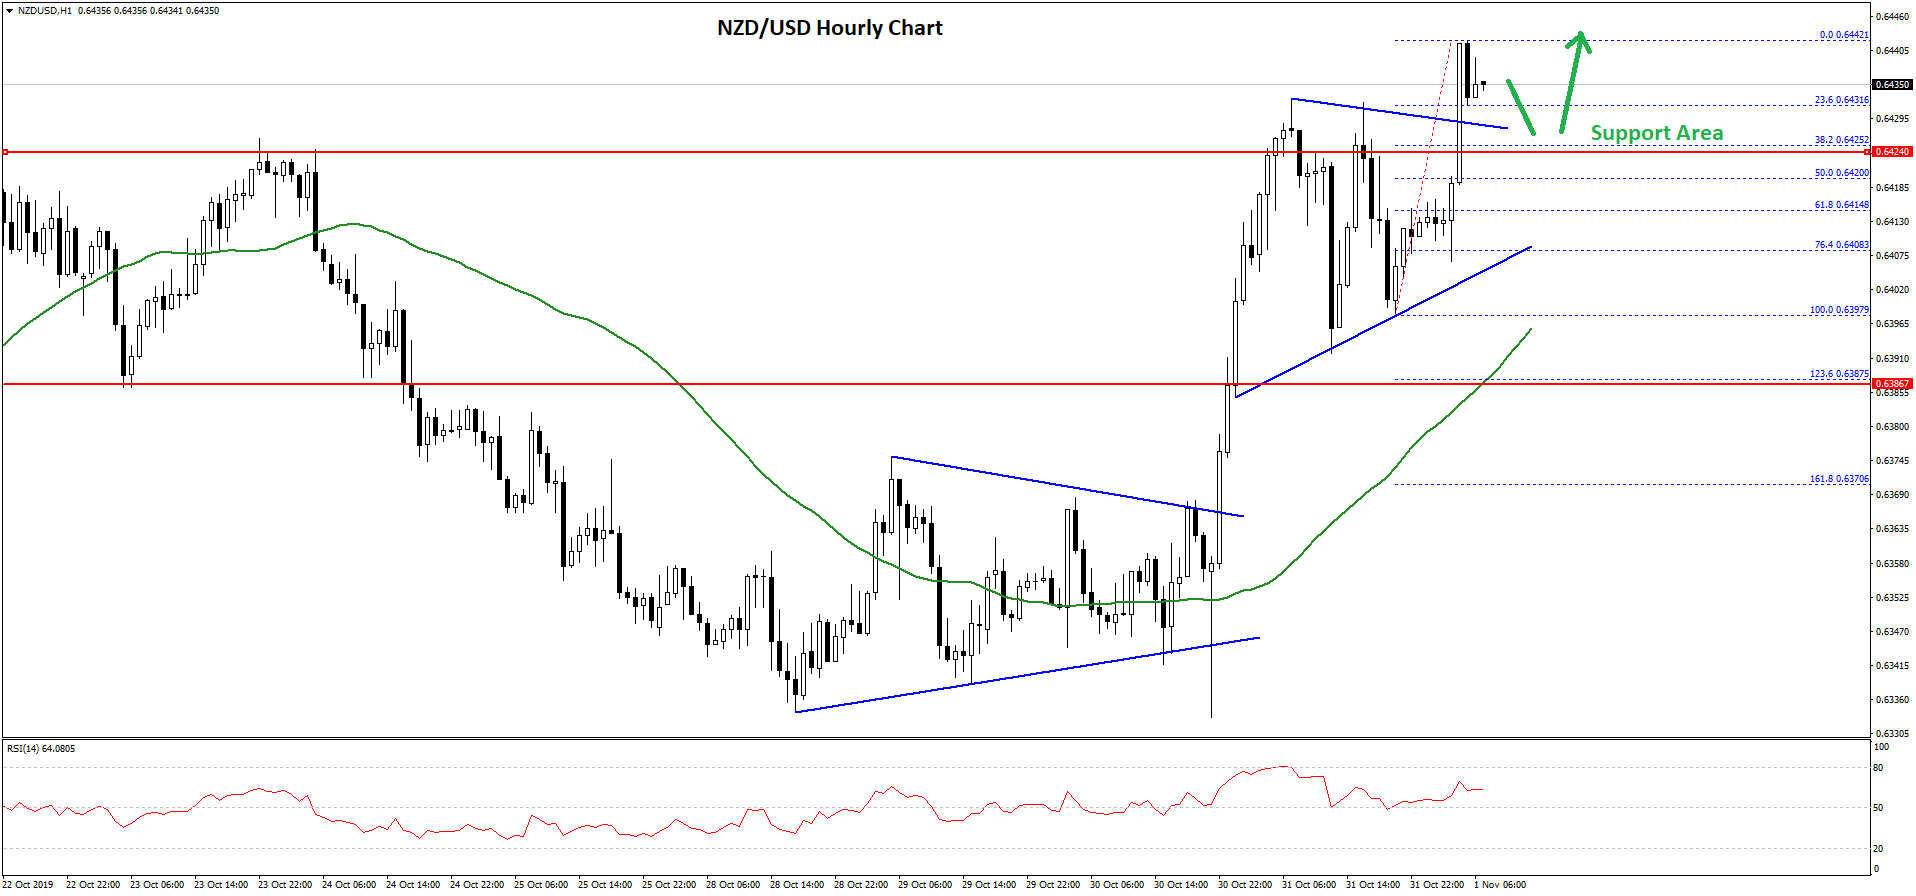
Later, the pair consolidating above the 0.6400 area. Finally, there was a break above a key contracting triangle with resistance near 0.6430 on the hourly chart of NZD/USD.
The pair traded towards the 0.6450 level and the recent high was formed near 0.6442. The pair is currently correcting lower and testing the 23.6% Fib retracement level of the recent leg from the 0.6397 low to 0.6442 high.
On the downside, there are many key supports near the 0.6420 and 0.6410 levels. The main support is near the 0.6400 area and the 50 hourly simple moving average. An intermediate support is the 50% Fib retracement level of the recent leg from the 0.6397 low to 0.6442 high.
Therefore, the pair remains well supported on the downside near the 0.6425 and 0.6410 levels. On the upside, a clear break above 0.6440 could push NZD/USD towards the 0.6460 level in the coming sessions.
Trade over 50 forex markets 24 hours a day with FXOpen. Take advantage of low commissions, deep liquidity, and spreads from 0.0 pips (additional fees may apply). Open your FXOpen account now or learn more about trading forex with FXOpen.
This article represents the opinion of the Companies operating under the FXOpen brand only. It is not to be construed as an offer, solicitation, or recommendation with respect to products and services provided by the Companies operating under the FXOpen brand, nor is it to be considered financial advice.
Stay ahead of the market!
Subscribe now to our mailing list and receive the latest market news and insights delivered directly to your inbox.


Latest articles

Amazon Earnings: Does the Chart Already Know Something the Numbers Don't?
All eyes are on July 30, when Amazon reports Q2 2026 earnings, with Wall Street increasingly convinced the bar has been set too low. Consensus sees EPS near $1.82-$2.26 on roughly $197 billion in revenue, but the

WTI Analysis: Gap Breaks Short-Term Trend as Price Remains Trapped Between the POC and Profile Boundary
WTI crude oil plunged by more than 7% on 27 July 2026 after the US suspended a series of strikes against Iran over the weekend, raising hopes of a diplomatic solution and the reopening of shipping through the Strait of

US Dollar Index: A Defining Week for the King of the Markets
The dollar heads into a pivotal week trading near 101.80, just off a 15-month high, with the Fed's July 29 meeting standing as the clear focal point. Markets currently price roughly a 65% chance of a hold, though renewed