AUD/USD and NZD/USD Could Extend Declines
FXOpen
AUD/USD failed to settle above 0.7200 and declined. Similarly, NZD/USD faced a strong resistance near 0.6600-0.6610 and weakened. Both pairs are currently in a bearish zone and they could extend losses in the short term.
Important Takeaways for AUD/USD and NZD/USD
- The Aussie Dollar recovery was capped by the 0.7200 and 0.7210 resistances against the US Dollar.
- There is a declining channel in place with resistance at 0.7195 on the hourly chart of AUD/USD.
- NZD/USD failed near a crucial bearish trend line with resistance at 0.6610 on the hourly chart.
- Australia’s Home Loans in July 2018 increased 0.4%, more than the forecast of 0%.
AUD/USD Technical Analysis
The Aussie Dollar recovered recently after trading as low as 0.7144 against the US Dollar. The AUD/USD pair traded above the 0.7150 and 0.7180 resistance levels, but it failed to settle above the 0.7200 level.
The pair made many attempts to break the 0.7200 and 0.7210 resistance levels, but sellers defended gains. The recent high was 0.7212 before the pair traded below the 0.7200 and 0.7180 support levels.
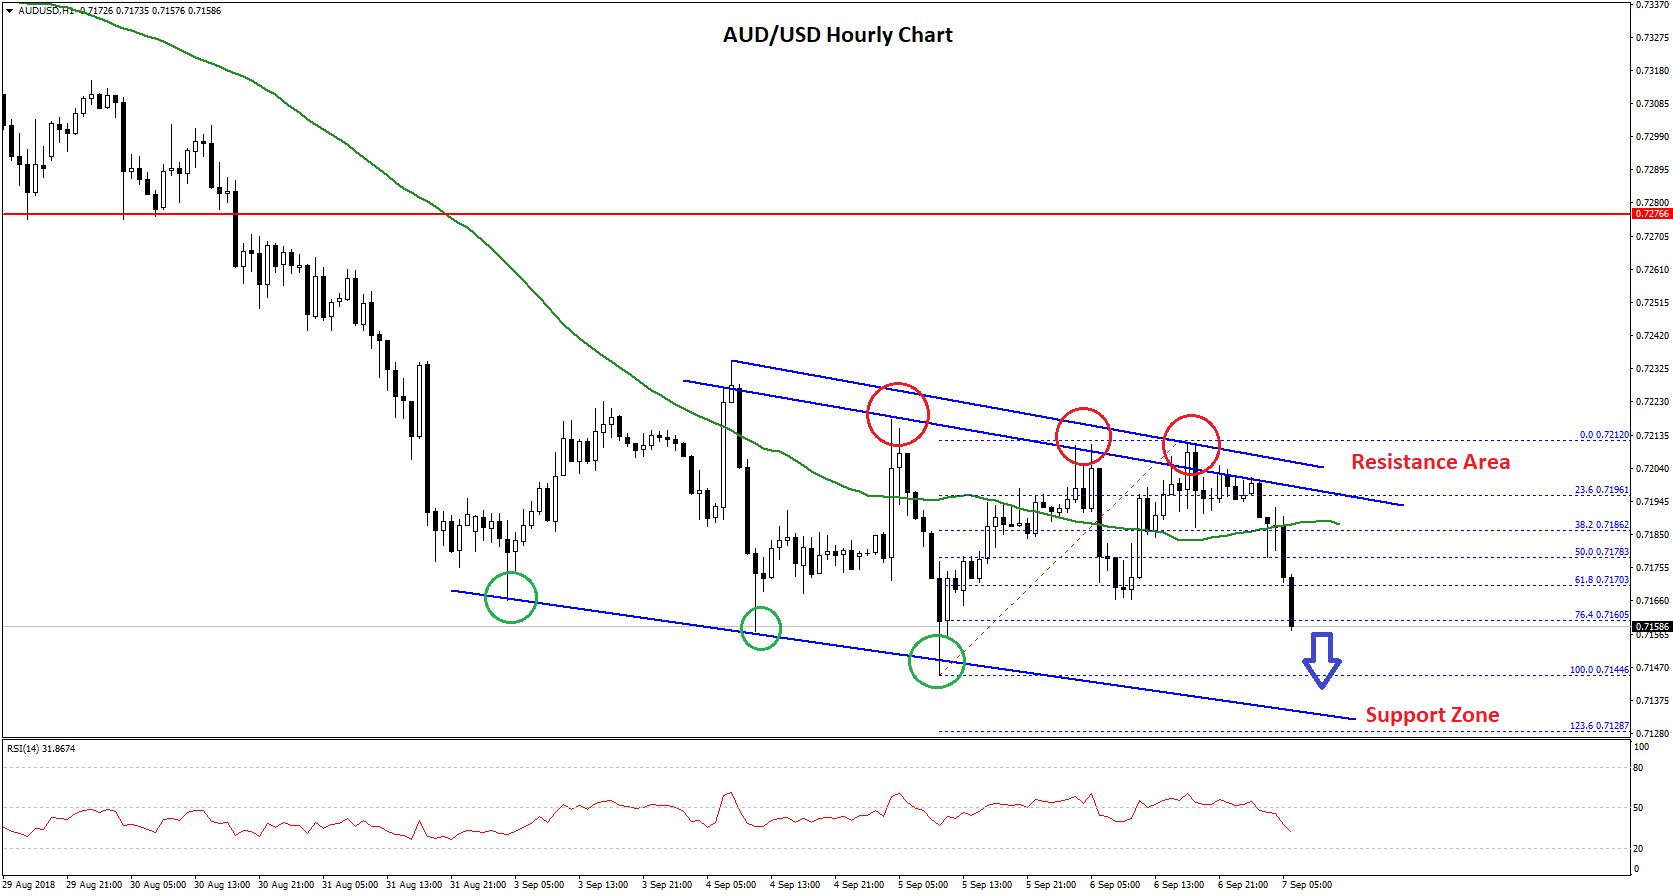
It even broke the 50% Fib retracement level of the last wave from the 0.7144 low to 0.7212 high, and also settled below the 50 hourly simple moving average. It seems like the pair is following a declining channel with resistance at 0.7195 on the hourly chart.
As long as the pair is below the 0.7200 resistance, it could continue to move down. The next stop for sellers could be near the last low of 0.7144. Below this, there are chances of a test of the 1.236 Fib extension level of the last wave from the 0.7144 low to 0.7212 high at 0.7128.
On the other hand, if the pair breaks the channel resistance and settles above 0.7200, then it may well trade towards the 0.7240 and 0.7250 resistances.
Fundamentally, Australia’s Home Loans figure for July 2018 was released by the Australian Bureau of Statistics today. The market positioned for no change in home loans, but the outcome was positive as there was a rise of 0.4% in home loans. It was also better than the last decline of 1.1%.
However, it failed to help the AUD/USD pair and it remains at a risk of more losses below 0.7150.
NZD/USD Technical Analysis
The New Zealand Dollar traded higher after forming a support base near the 0.6530 level against the US Dollar. The NZD/USD pair traded above the 0.6550 and 0.6580 resistance levels.
However, the pair faced a strong resistance near the 0.6600 and 0.6610 levels. More importantly, a crucial bearish trend line with current resistance at 0.6610 on the hourly chart acted as a barrier for buyers.
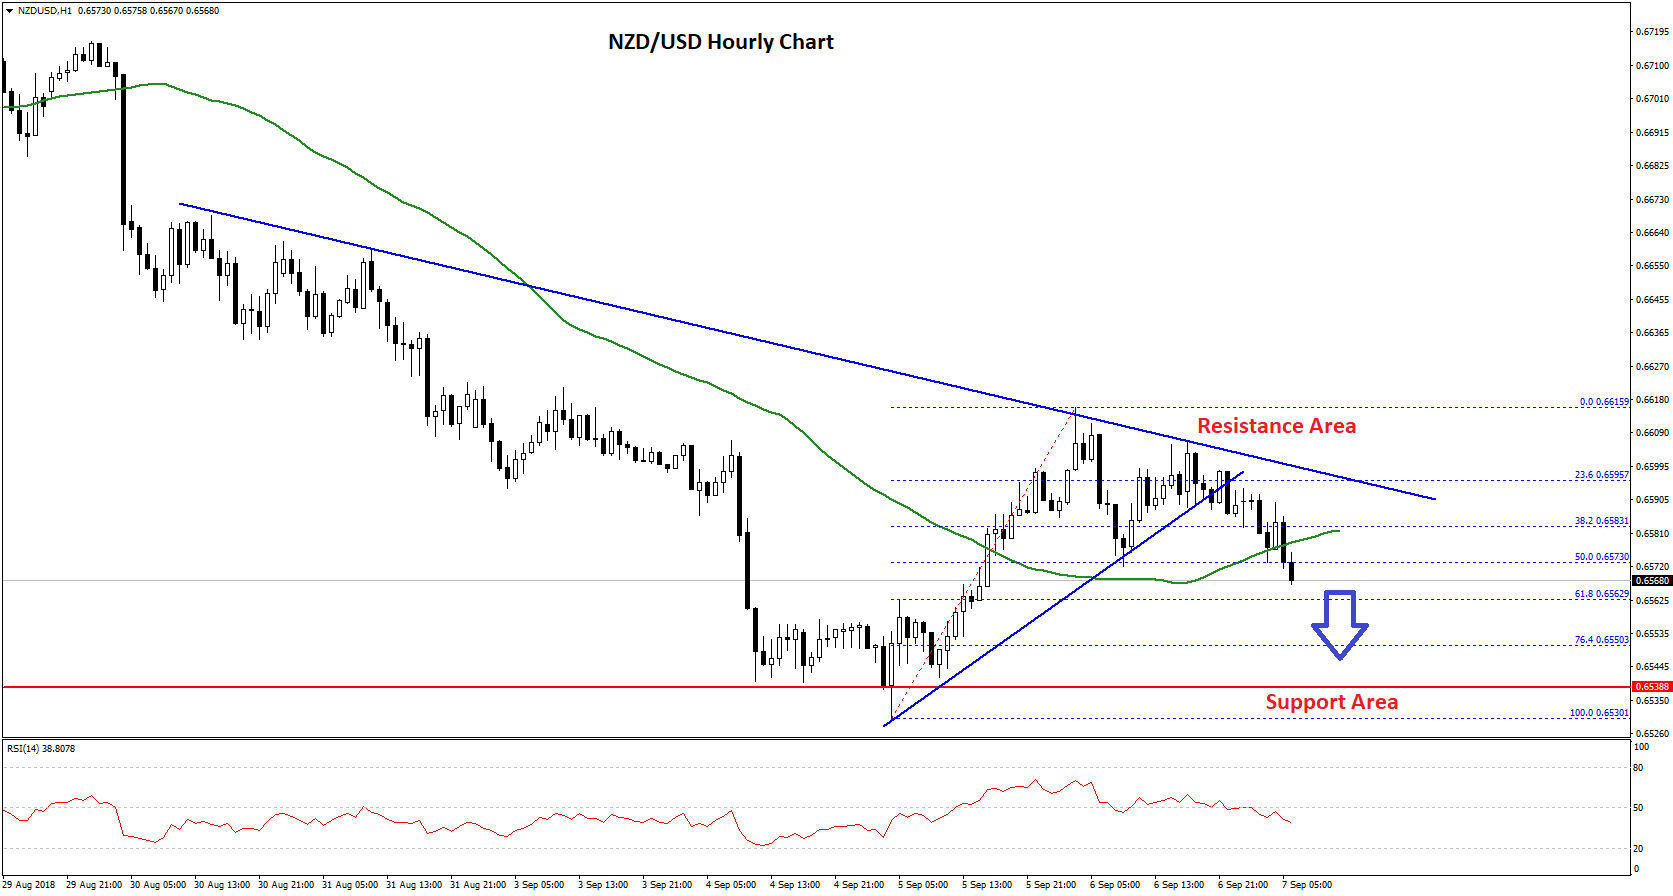
The pair formed a top at 0.6615 and later started a downside move. It broke the 0.6580 support, a bullish trend line on the same chart, and the 50 hourly simple moving average.
It also cleared the 50% Fib retracement level of the recent wave from the 0.6530 low to 0.6615 high. If sellers gain momentum, the pair could accelerate declines below 0.6560 in the near term.
The next support is around 0.6550 and the 76.4% Fib retracement level of the recent wave from the 0.6530 low to 0.6615 high. Below 0.6550, the pair could revisit the last swing low of 0.6530.
On the other hand, to gain bullish momentum, NZD/USD has to break the trend line and the 0.6610 resistance in the near term.
Trade over 50 forex markets 24 hours a day with FXOpen. Take advantage of low commissions, deep liquidity, and spreads from 0.0 pips (additional fees may apply). Open your FXOpen account now or learn more about trading forex with FXOpen.
This article represents the opinion of the Companies operating under the FXOpen brand only. It is not to be construed as an offer, solicitation, or recommendation with respect to products and services provided by the Companies operating under the FXOpen brand, nor is it to be considered financial advice.
Stay ahead of the market!
Subscribe now to our mailing list and receive the latest market news and insights delivered directly to your inbox.


Latest articles


Australian Dollar Loses Momentum After May Peaks
Fundamental Background
The RBA’s third consecutive interest rate increase to 4.35% reflects the regulator’s concern over rising inflation: the conflict in the Middle East is increasing energy costs and putting upward pressure on prices. Annual consumer inflation