


AUD/USD and NZD/USD Could Extend Losses
FXOpen
AUD/USD failed to break the 0.7200 resistance and declined sharply. Similarly, NZD/USD is under pressure and it recently broke the 0.6840 support level.
Important Takeaways for AUD/USD and NZD/USD
- The Aussie Dollar declined recently and broke the 0.7160 and 0.7150 supports against the US Dollar.
- There is a major bearish trend line in place with resistance at 0.7120 on the hourly chart of AUD/USD.
- NZD/USD started a major slide it failed to move above the 0.6900 resistance level.
- There is a crucial connecting bearish trend line formed with resistance at 0.6850 on the hourly chart.
AUD/USD Technical Analysis
This past week, the Aussie Dollar traded higher and broke the 0.7120 and 0.7150 resistance levels against the US Dollar. The AUD/USD pair even broke the 0.7180 resistance, but it faced a major hurdle near the 0.7200 area.
The pair traded as high as 0.7196 on FXOpen and later started a major downside move. Sellers gained pace and pushed the pair below the 0.7150 and 0.7120 support levels. The decline was such that the pair even broke the 0.7100 support level and the 50 hourly simple moving average.
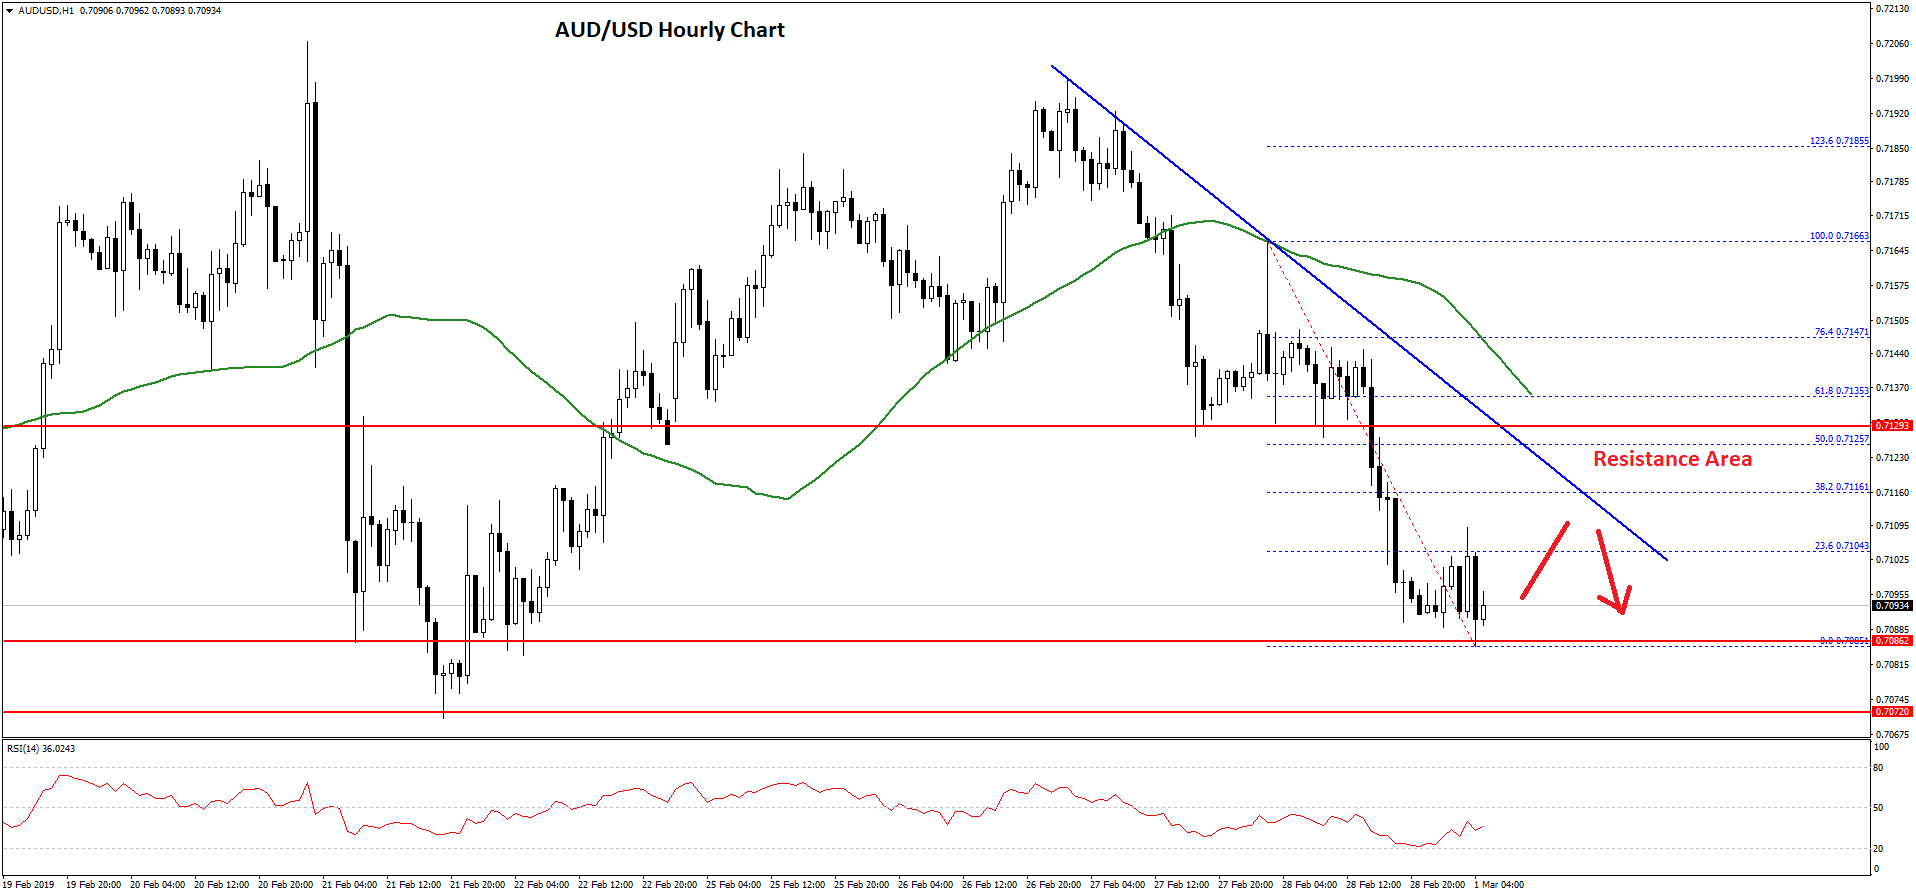
A low was formed at 0.7085 and the pair is currently consolidating losses. An initial resistance is near 0.7110 and the 23.6% Fib retracement level of the recent decline from the 0.7166 high to 0.7085 low.
On the upside, there are many resistances near the 0.7120 and 0.7130 levels. There is also a major bearish trend line in place with resistance at 0.7120 on the hourly chart of AUD/USD.
Besides, the 50% Fib retracement level of the recent decline from the 0.7166 high to 0.7085 low is near the 0.7125 level. Therefore, the pair must break the 0.7120 and 0.7125 resistance levels to move into a positive zone.
On the other hand, an initial support is at 0.7085, below which the pair may perhaps continue to decline towards the 0.7070 and 0.7050 support levels.
NZD/USD Technical Analysis
The New Zealand Dollar also followed a similar pattern and started a major decline from well above the 0.6880 level against the US Dollar. The NZD/USD pair broke the 0.6870 and 0.6850 support levels to move into a bearish zone.
The pair broke the 0.6820 support and the 50 hourly simple moving average. It traded close to the 0.6800 support level and formed a low at 0.6796.
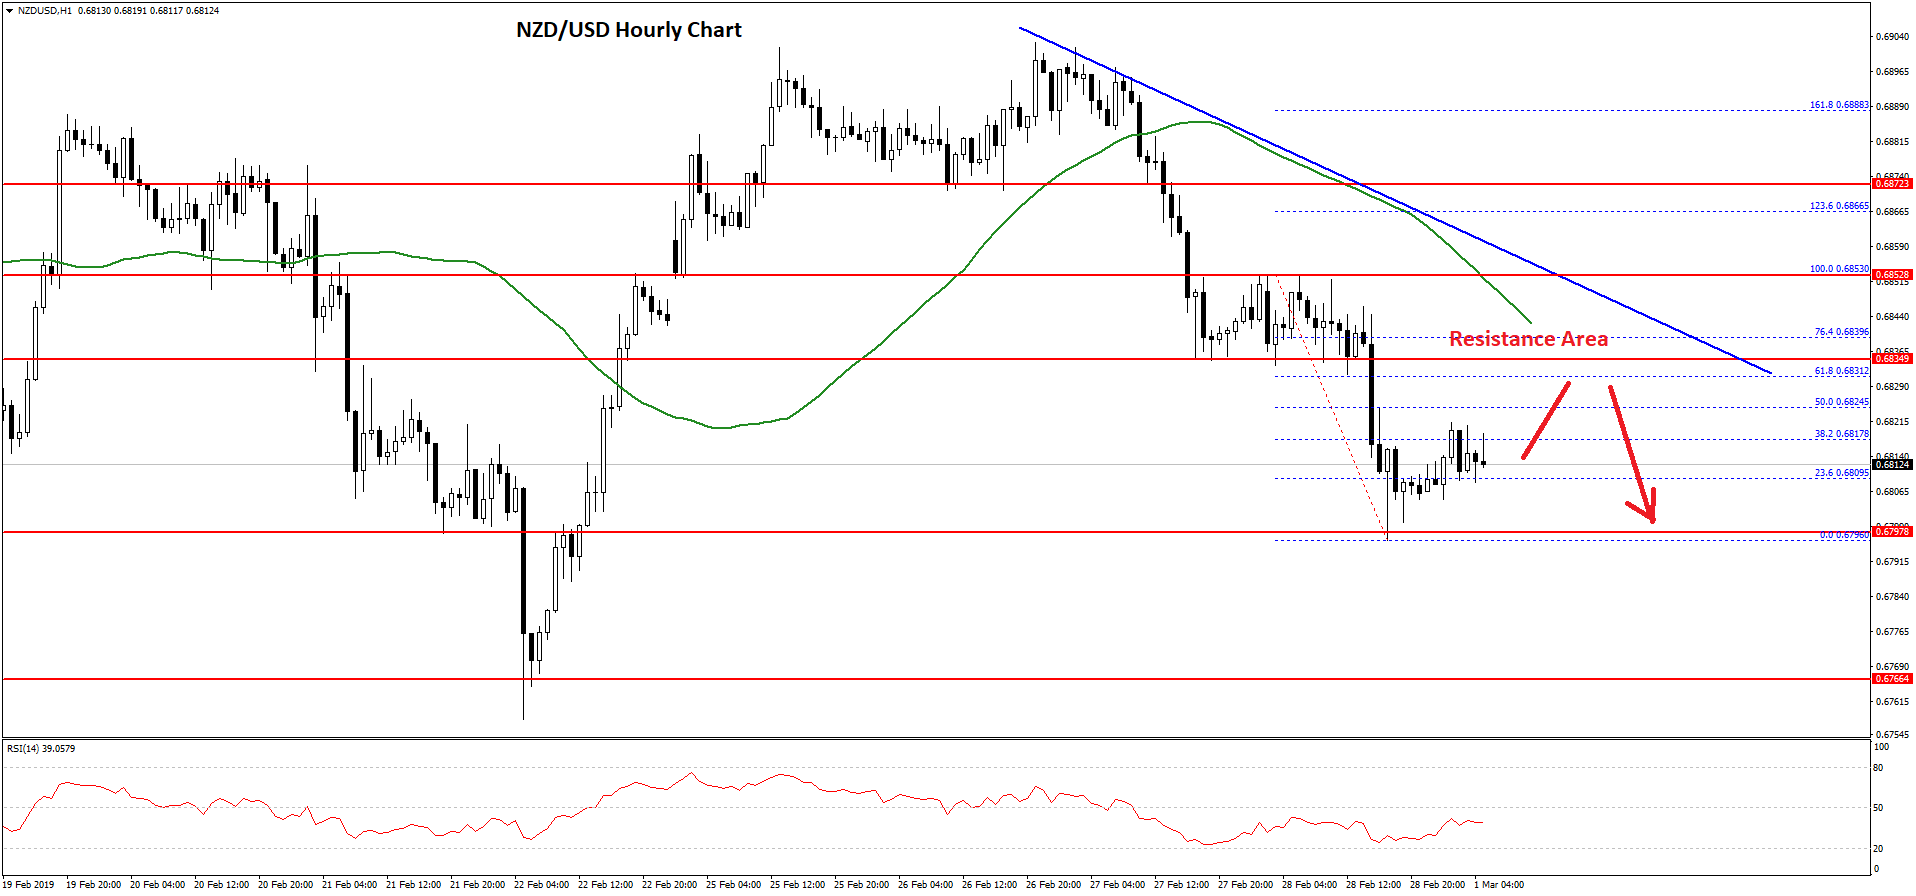
Later, the pair started a short term upside correction and tested the 38.2% Fib retracement level of the recent decline from the 0.6853 high to 0.6798 low. On the upside, there are many hurdles for buyers near the 0.6830 and 0.6840 levels.
There is also a crucial connecting bearish trend line formed with resistance at 0.6850 on the hourly chart. The 50% Fib retracement level of the recent decline from the 0.6853 high to 0.6798 low is also near 0.6825 to act as a resistance.
Therefore, the pair is likely to face a lot of hurdles on the upside near the 0.6825-0.6835 zone. On the downside, the 0.6800 level is a strong support. If there is a bearish break below the 0.6800 support, the pair could decline sharply towards the 0.6760 and 0.6750 support levels.
Trade over 50 forex markets 24 hours a day with FXOpen. Take advantage of low commissions, deep liquidity, and spreads from 0.0 pips (additional fees may apply). Open your FXOpen account now or learn more about trading forex with FXOpen.
This article represents the opinion of the Companies operating under the FXOpen brand only. It is not to be construed as an offer, solicitation, or recommendation with respect to products and services provided by the Companies operating under the FXOpen brand, nor is it to be considered financial advice.
Stay ahead of the market!
Subscribe now to our mailing list and receive the latest market news and insights delivered directly to your inbox.


Latest articles

Weekly Market Insights with Gary Thomson: The Week of Central Banks and Earnings
In this video, we’ll explore the key economic events and market trends, shaping the financial landscape. Get ready for insights into financial markets to help you navigate the week ahead. Let’s dive in!
In this episode of Market

Intel at a Crossroads: Earnings Beat Meets Technical Resistance
Intel has just delivered its strongest quarter in over fifteen years, and the market reaction says it all. Q2 2026 revenue surged 25% year-over-year to $16.1 billion, crushing the consensus estimate of $14.42 billion, while adjusted EPS of

Tesla: Complex Range Structure Breaks Down Following Quarterly Earnings
Tesla released its Q2 2026 results after the market closed on 22 July. Revenue increased 26% year-on-year to $28.24 billion, while vehicle deliveries reached a record 480,126 units. However, operating margin fell sharply to 1.4%, down from