


AUD/USD And NZD/USD Could Extend Rally
FXOpen

AUD/USD is gaining traction and it is trading nicely above the 0.6900 level. Similarly, NZD/USD is rising and it might soon surge above the 0.6500 resistance zone.
Important Takeaways for AUD/USD and NZD/USD
- The Aussie Dollar started a steady increase from the 0.6640 support zone against the US Dollar.
- There is a major bullish trend line forming with support near 0.6930 on the hourly chart of AUD/USD.
- NZD/USD is also gaining bullish momentum and trading well above the 0.6450 level.
- There is a key bullish trend line forming with support at 0.6440 on the hourly chart of NZD/USD.
AUD/USD Technical Analysis
The Aussie Dollar formed a strong support above 0.6600 and started a fresh increase against the US Dollar. The AUD/USD pair broke many hurdles near 0.6750 to move into a positive zone.
The upward move was such that the pair settled nicely above the 0.6800 level and the 50 hourly simple moving average. It even traded towards the 0.7000 level and formed a new monthly high at 0.6987 on FXOpen.
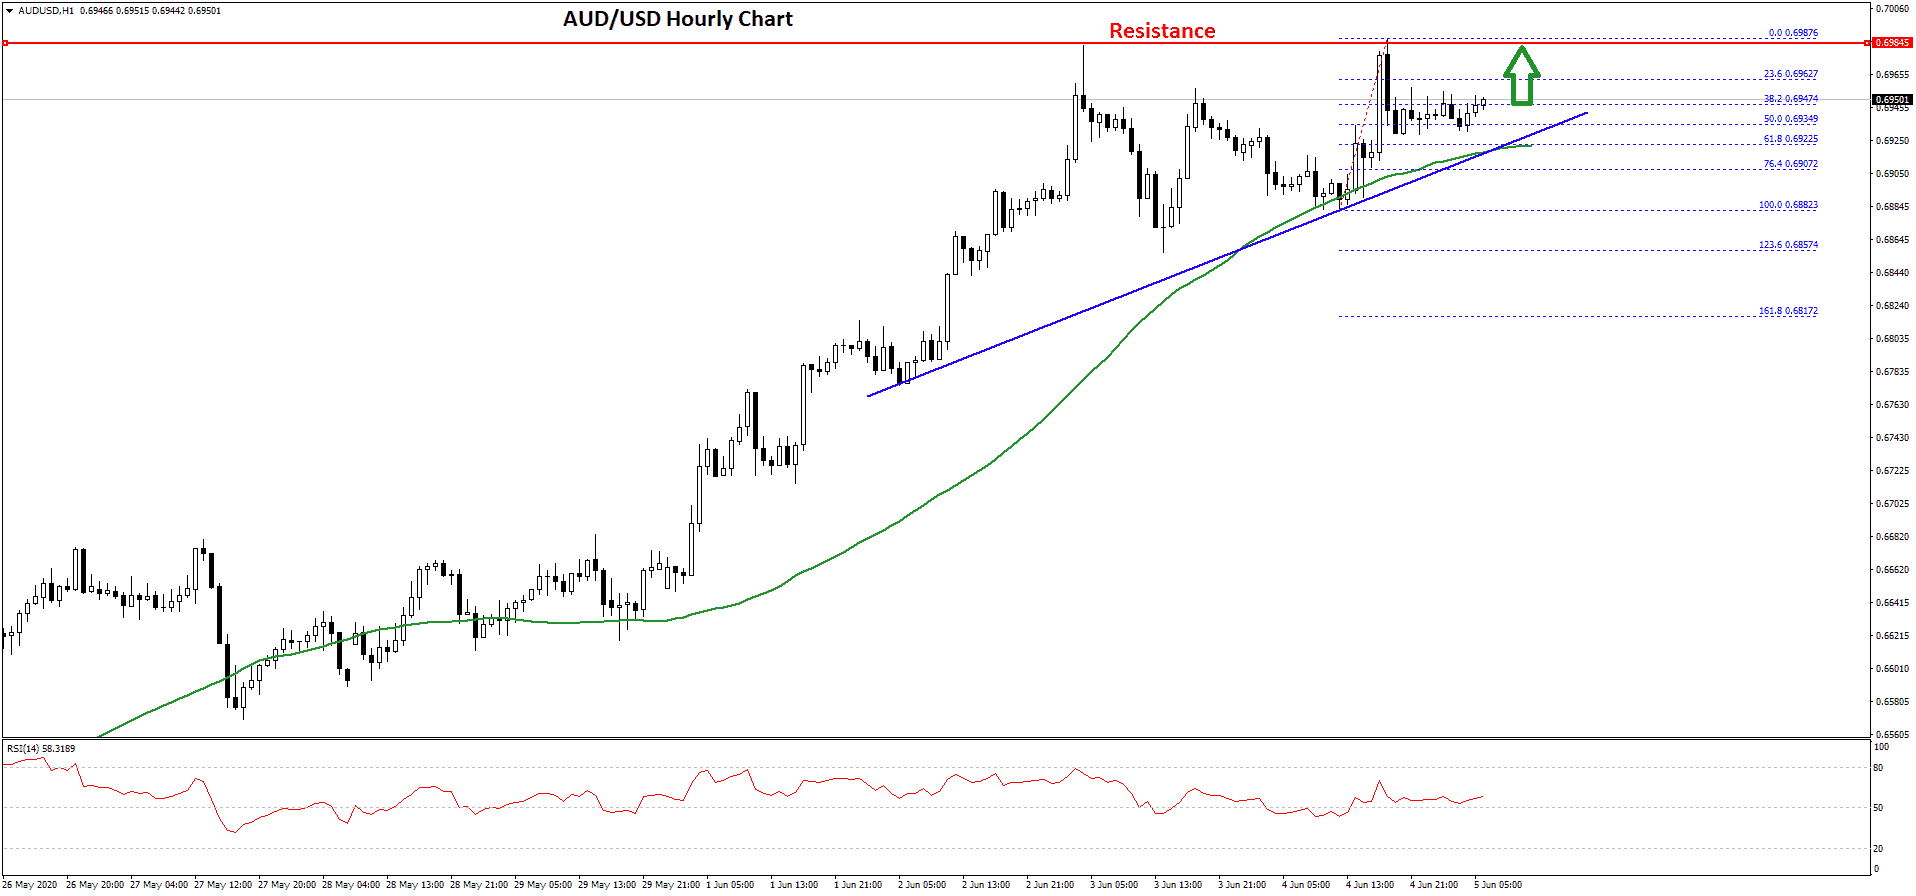
Recently, there was a short-term downside correction from the 0.6987 high. There was a break below the 23.6% Fib retracement level of the upward move from the 0.6882 low to 0.6987 high.
However, the decline was protected by the 0.6930 level. It seems like the 50% Fib retracement level of the upward move from the 0.6882 low to 0.6987 high is acting as a strong support.
There is also a major bullish trend line forming with support near 0.6930 on the hourly chart of AUD/USD. If the pair fails to stay above the trend line support and the 50 hourly simple moving average, there is a risk of a sharp downside correction towards the 0.6850 support level.
On the upside, an initial resistance is near the 0.6980 and 0.7000 levels. If AUD/USD settles above the 0.7000 resistance zone, there could be a sustained upward move towards the 0.7050 and 0.7080 levels in the near term.
NZD/USD Technical Analysis
The New Zealand Dollar also followed a similar path and climbed higher nicely from the 0.6200 support zone against the US Dollar. The NZD/USD pair broke many key hurdles near the 0.6300 level to move further into a positive zone.
The pair even settled above the 0.6400 level and the 50 hourly simple moving average. A new monthly high is formed near 0.6478 and the pair is showing signs of more upsides in the near term.
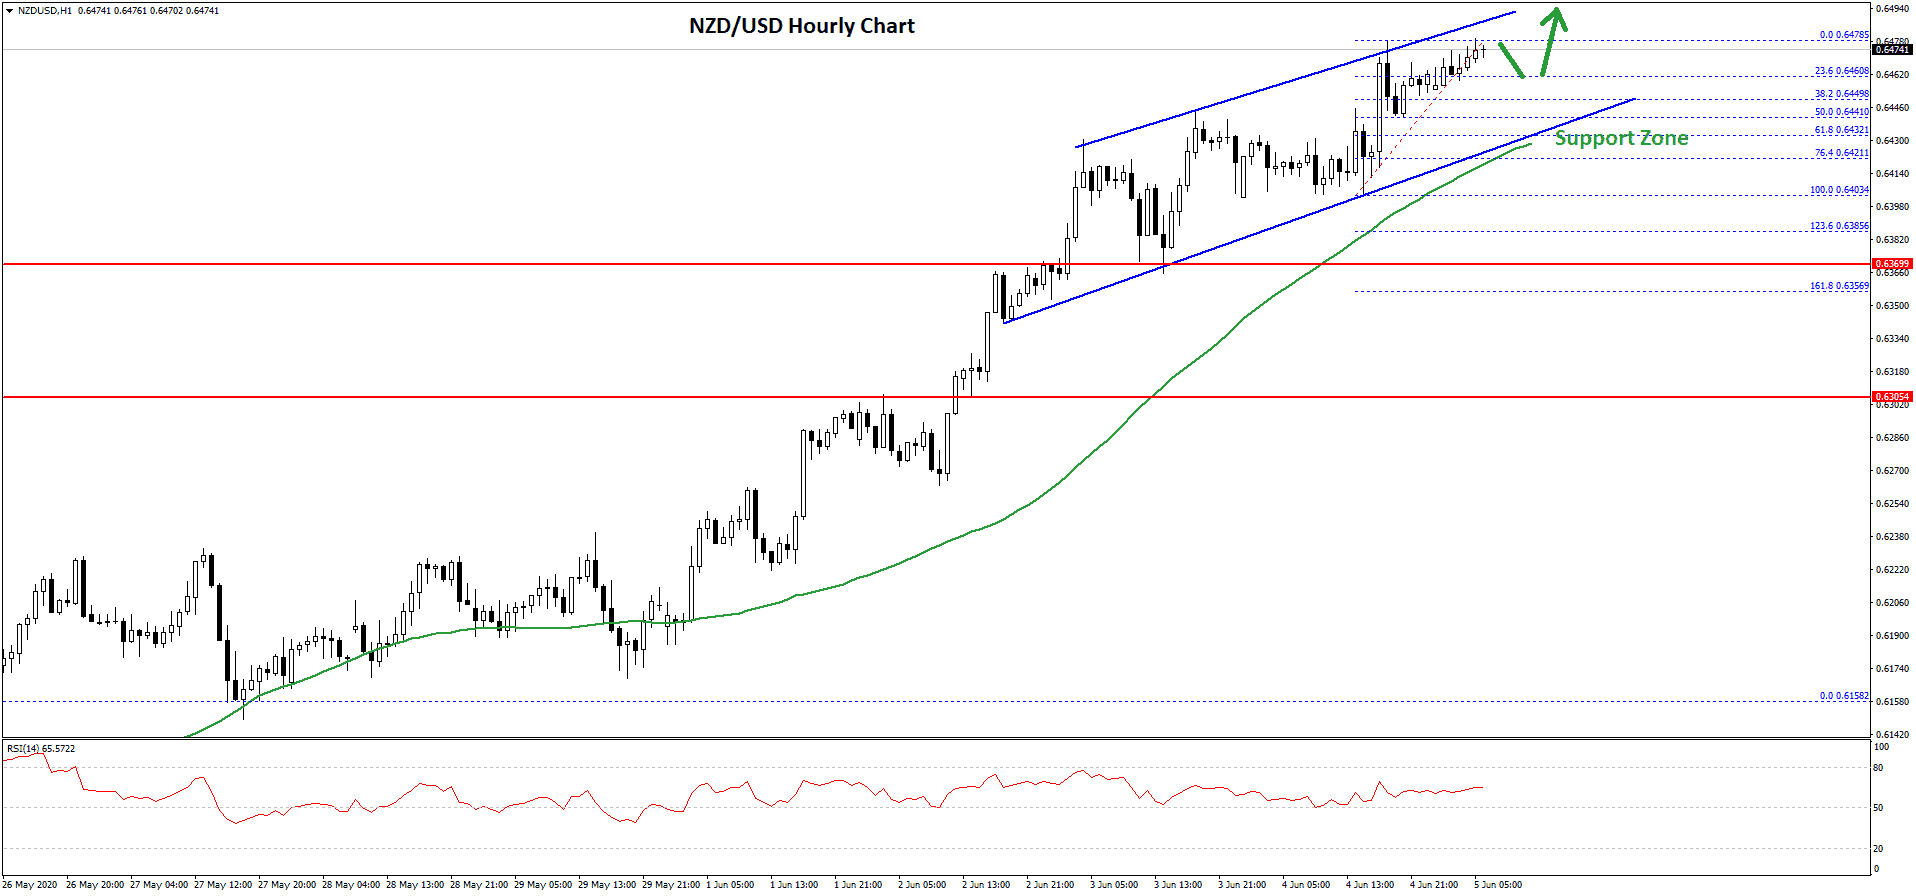
If there is a downside correction, an initial support is near the 23.6% Fib retracement level of the upward move from the 0.6403 low to 0.6478 high at 0.6460.
The first major support is seen near the 0.6440 level. There is also a key bullish trend line forming with support at 0.6440 on the hourly chart of NZD/USD. The trend line is close to the 50% Fib retracement level of the upward move from the 0.6403 low to 0.6478 high.
Below the trend line, the next support is near the 0.6425 level and the 50 hourly simple moving average. Any further losses may perhaps call for an extended decline towards the 0.6380 support zone.
On the upside, an initial resistance is seen near the 0.6480 level, above which NZD/USD might attempt to surge above the 0.6500 resistance zone.
Trade over 50 forex markets 24 hours a day with FXOpen. Take advantage of low commissions, deep liquidity, and spreads from 0.0 pips (additional fees may apply). Open your FXOpen account now or learn more about trading forex with FXOpen.
This article represents the opinion of the Companies operating under the FXOpen brand only. It is not to be construed as an offer, solicitation, or recommendation with respect to products and services provided by the Companies operating under the FXOpen brand, nor is it to be considered financial advice.
Stay ahead of the market!
Subscribe now to our mailing list and receive the latest market news and insights delivered directly to your inbox.


Latest articles

USD/JPY and USD/CHF Near Key Levels: The Dollar Supported by the Fed
The US dollar continues to trend upwards following the Federal Reserve meeting, drawing support from the regulator’s moderately hawkish stance and comments by Jerome Powell. Markets interpret the Fed’s rhetoric as a signal that restrictive policy is likely

EUR/USD and GBP/USD consolidate ahead of the Fed decision
European currencies are showing subdued dynamics, entering a consolidation phase following their previous advance. Earlier, EUR/USD and GBP/USD broke out of their ranges and strengthened; however, the subsequent correction has led both pairs to retest the previously breached

Meta: V-Shaped Recovery Meets Heavy Volume Resistance
The movement in Meta Platforms shares is being driven by two competing narratives. On one hand, advertising revenue is benefiting from AI-based tools: the Advantage+ platform continues to support strong advertiser demand, and the analyst consensus for Q1 2026 revenue