


AUD/USD and NZD/USD Could Eye Fresh Increase
FXOpen
AUD/USD started a recovery wave above the 0.7000 resistance. NZD/USD is also showing a lot of positive signs above the 0.6300 level.
Important Takeaways for AUD/USD and NZD/USD
· The Aussie Dollar started a fresh increase from the 0.6850 support zone against the US Dollar.
· There was a break above a key bearish trend line with resistance near 0.6970 on the hourly chart of AUD/USD.
· NZD/USD also started a decent increase after it cleared the 0.6250 resistance zone.
· There was a move above a major bearish trend line with resistance near 0.6335 on the hourly chart of NZD/USD.
AUD/USD Technical Analysis
The Aussie Dollar formed a base above the 0.6850 level and started a fresh increase against the US Dollar. The AUD/USD pair gained pace for a move above the 0.6950 resistance zone.
There was a break above a key bearish trend line with resistance near 0.6970 on the hourly chart of AUD/USD. The bulls pushed the pair above the 50% Fib retracement level of the downward move from the 0.7226 swing high to 0.6850 low.
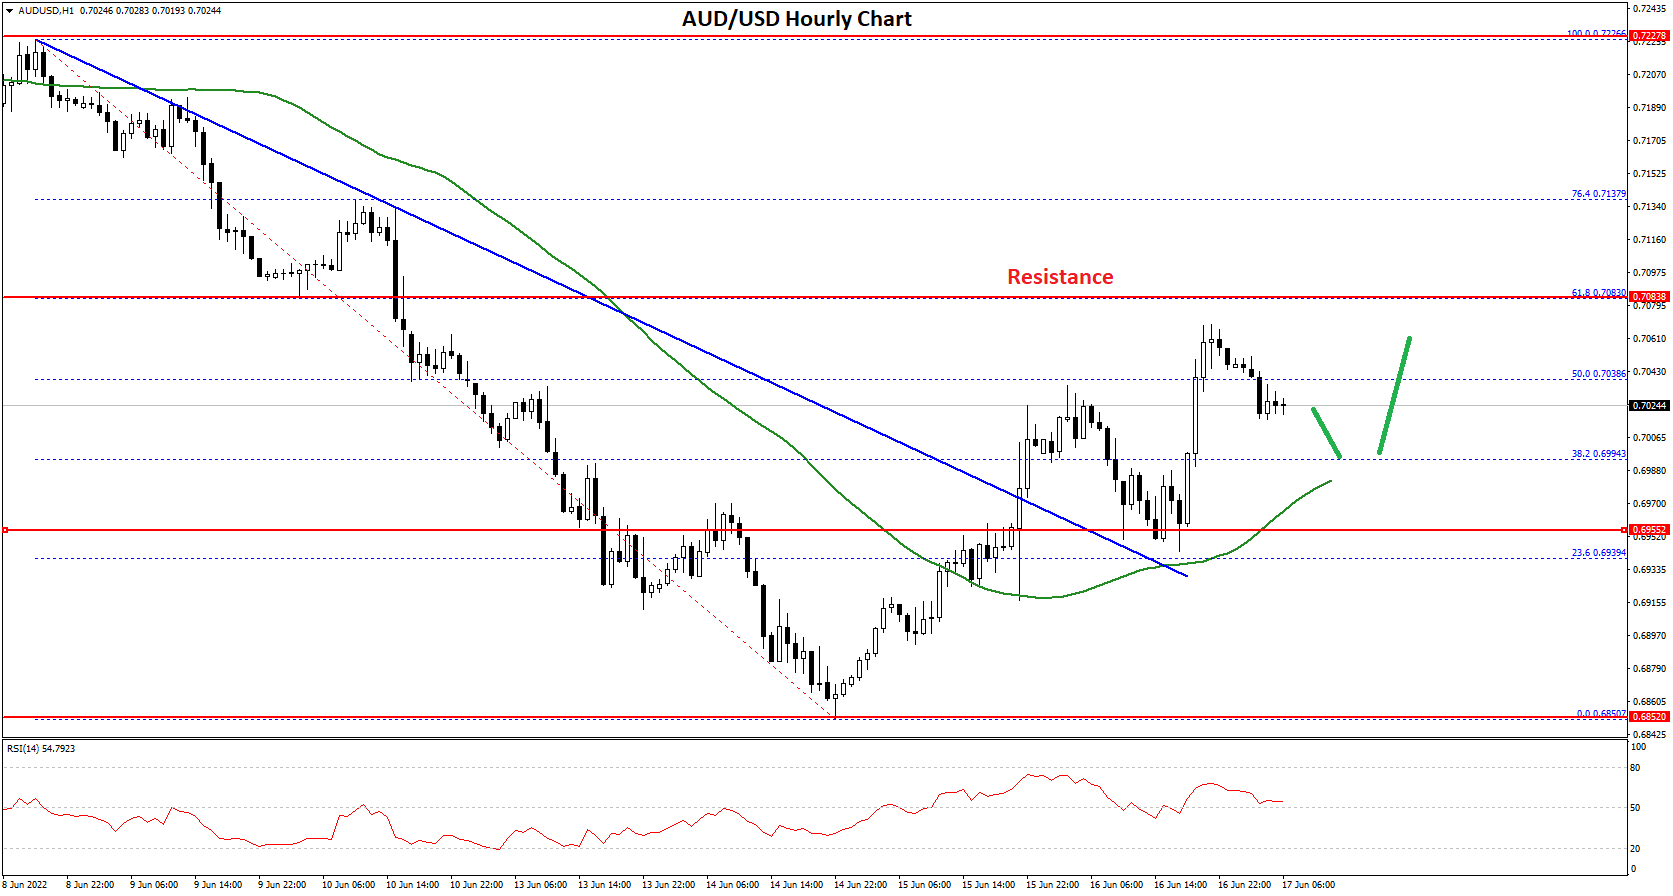
The pair even settled above the 0.7000 level and the 50 hourly simple moving average. It is now consolidating gains above the 0.7000 level. On the downside, an initial support is near the 0.7000 level.
The next support could be the 0.6980 level and the 50 hourly simple moving average. The main support is near the 0.6950 level. If there is a downside break below the 0.6950 support, the pair could extend its decline towards the 0.6850 level. Any more downsides might send the pair toward the 0.6780 level.
On the upside, the AUD/USD pair is facing resistance near the 0.7050 level. The next major resistance is near the 0.7080 level. It is near the 61.8% Fib retracement level of the downward move from the 0.7226 swing high to 0.6850 low.
A close above the 0.7080 level could start a steady increase in the near term. The next major resistance could be 0.7220.
NZD/USD Technical Analysis
The New Zealand Dollar also followed a similar path from the 0.6200 zone against the US Dollar. The NZD/USD pair gained pace above the 0.6250 resistance zone.
There was a clear move above the 0.6280 resistance zone and the 50 hourly simple moving average. Besides, there was a move above a major bearish trend line with resistance near 0.6335 on the hourly chart of NZD/USD.
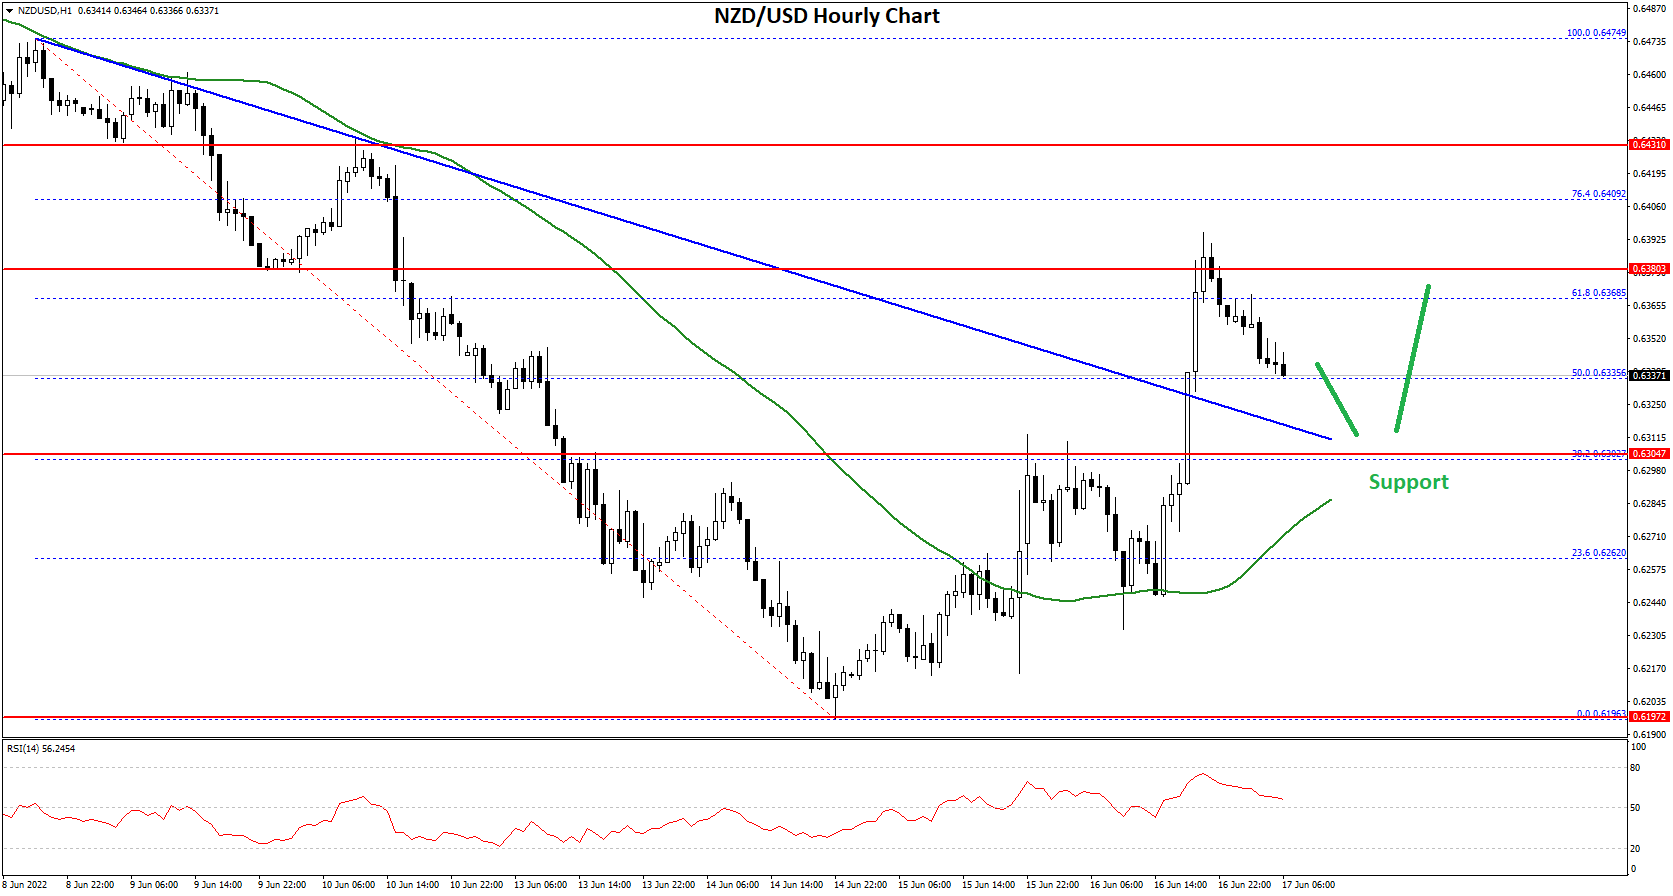
There was a clear move above the 50% Fib retracement level of the downward move from the 0.6474 swing high to 0.6196 low. It even spiked above the 0.6370 level.
It is now correcting gains and trading close to the 0.6330 level. On the downside, an initial support is near the 0.6320 level. The next support could be the 0.6300 zone. If there is a downside break below the 0.6300 support, the pair could extend its decline towards the 0.6250 level.
On the upside, an initial resistance is near the 0.6375 level. The next major resistance is near the 0.6400 level. A clear move above the 0.6400 level might even push the pair towards the 0.6480 level.
This forecast represents FXOpen Markets Limited opinion only, it should not be construed as an offer, invitation or recommendation in respect to FXOpen Markets Limited products and services or as financial advice.
Trade over 50 forex markets 24 hours a day with FXOpen. Take advantage of low commissions, deep liquidity, and spreads from 0.0 pips (additional fees may apply). Open your FXOpen account now or learn more about trading forex with FXOpen.
This article represents the opinion of the Companies operating under the FXOpen brand only. It is not to be construed as an offer, solicitation, or recommendation with respect to products and services provided by the Companies operating under the FXOpen brand, nor is it to be considered financial advice.
Stay ahead of the market!
Subscribe now to our mailing list and receive the latest market news and insights delivered directly to your inbox.


Latest articles

GBP/CHF: Trendline or RSI — Which One Is Lying?
Sterling enters this week on firmer footing, with political uncertainty fading fast after Andy Burnham's confirmation as Labour leader eased investor concerns over the succession to Keir Starmer. Markets reacted further to reports pointing to Shabana Mahmood as the frontrunner

Silver Attempts to Break Out of Its Range
Silver continues to balance between its dual role as an industrial metal and so-called refuge asset, and this combination largely explains the lack of a clear trend in recent weeks. Shifting expectations for central bank interest rates can influence the

Nasdaq 100: Is This the Correction Traders Have Been Waiting For?
The Nasdaq 100 (US Tech 100 Mini on FXOpen) remains caught between two opposing forces: cooling inflation on one side, and persistent geopolitical instability on the other. On 14 July, June's CPI print came in softer than expected, easing near-term