


AUD/USD and NZD/USD Could Gain Bullish Momentum
FXOpen

AUD/USD started a fresh increase above the 0.6700 resistance zone. NZD/USD is rising and might aim a move above the 0.6300 resistance.
Important Takeaways for AUD/USD and NZD/USD
· The Aussie Dollar started a fresh increase above the 0.6700 resistance against the US Dollar.
· There was a break above a major bearish trend line with resistance near 0.6692 on the hourly chart of AUD/USD.
· NZD/USD started a decent increase above the 0.6250 resistance zone.
· There was a clear move above a key bearish trend line with resistance near 0.6265 on the hourly chart of NZD/USD.
AUD/USD Technical Analysis
The Aussie Dollar found support near 0.6620 and started a decent increase against the US Dollar. The AUD/USD pair gained pace for a move above the 0.6650 resistance.
The pair even moved above the 0.6685 level and the 50 hourly simple moving average. There was a break above a major bearish trend line with resistance near 0.6692 on the hourly chart of AUD/USD. The bulls were able to pump the pair above 0.6720 and the 50 hourly simple moving average.
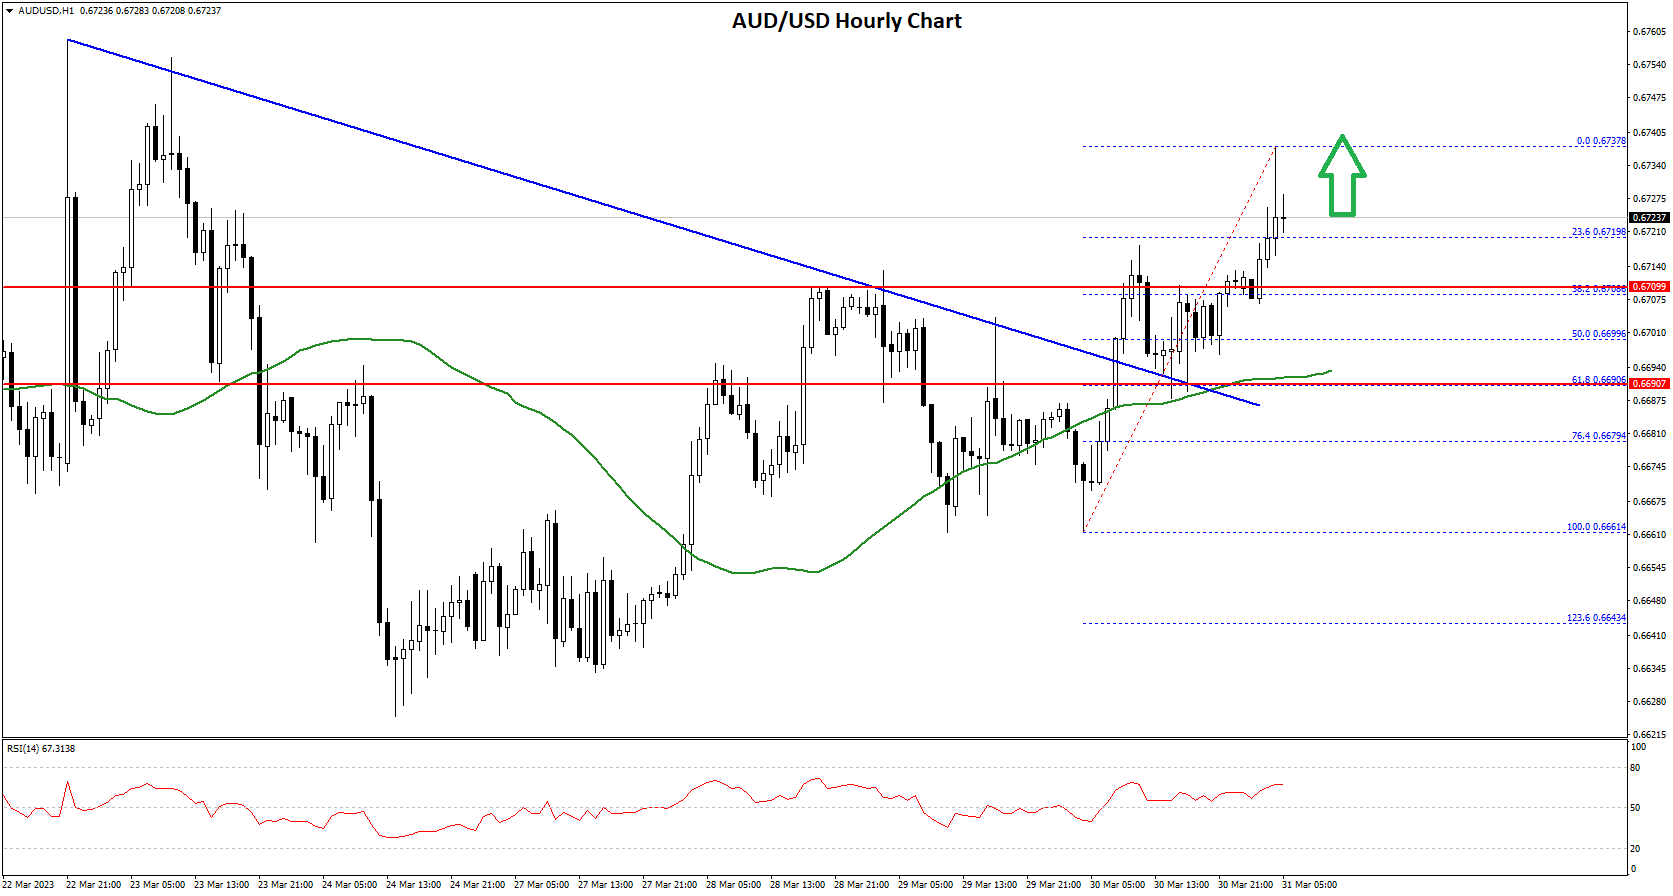
A high is formed near 0.6737 on FXOpen and the pair is now consolidating gains. On the downside, an initial support is near the 0.6720 level. It is near the 23.6% Fib retracement level of the recent increase from the 0.6661 swing low to 0.6737 high.
The next support could be the 0.6700 level or the 50 hourly simple moving average or the 50% Fib retracement level of the recent increase from the 0.6661 swing low to 0.6737 high.
If there is a downside break below the 0.6700 support, the pair could extend its decline towards the 0.6650 level. On the upside, the AUD/USD pair is facing resistance near the 0.6740 level. The next major resistance is near the 0.6780 level.
A close above the 0.6780 level could start another steady increase in the near term. The next major resistance could be 0.6850.
NZD/USD Technical Analysis
The New Zealand Dollar started a decent increase from the 0.6200 support zone against the US Dollar. The NZD/USD pair climbed above the 0.6220 and 0.6240 resistance levels.
The bulls pushed the pair above the 0.6250 level and the 50 hourly simple moving average. There was a clear move above a key bearish trend line with resistance near 0.6265 on the hourly chart of NZD/USD.
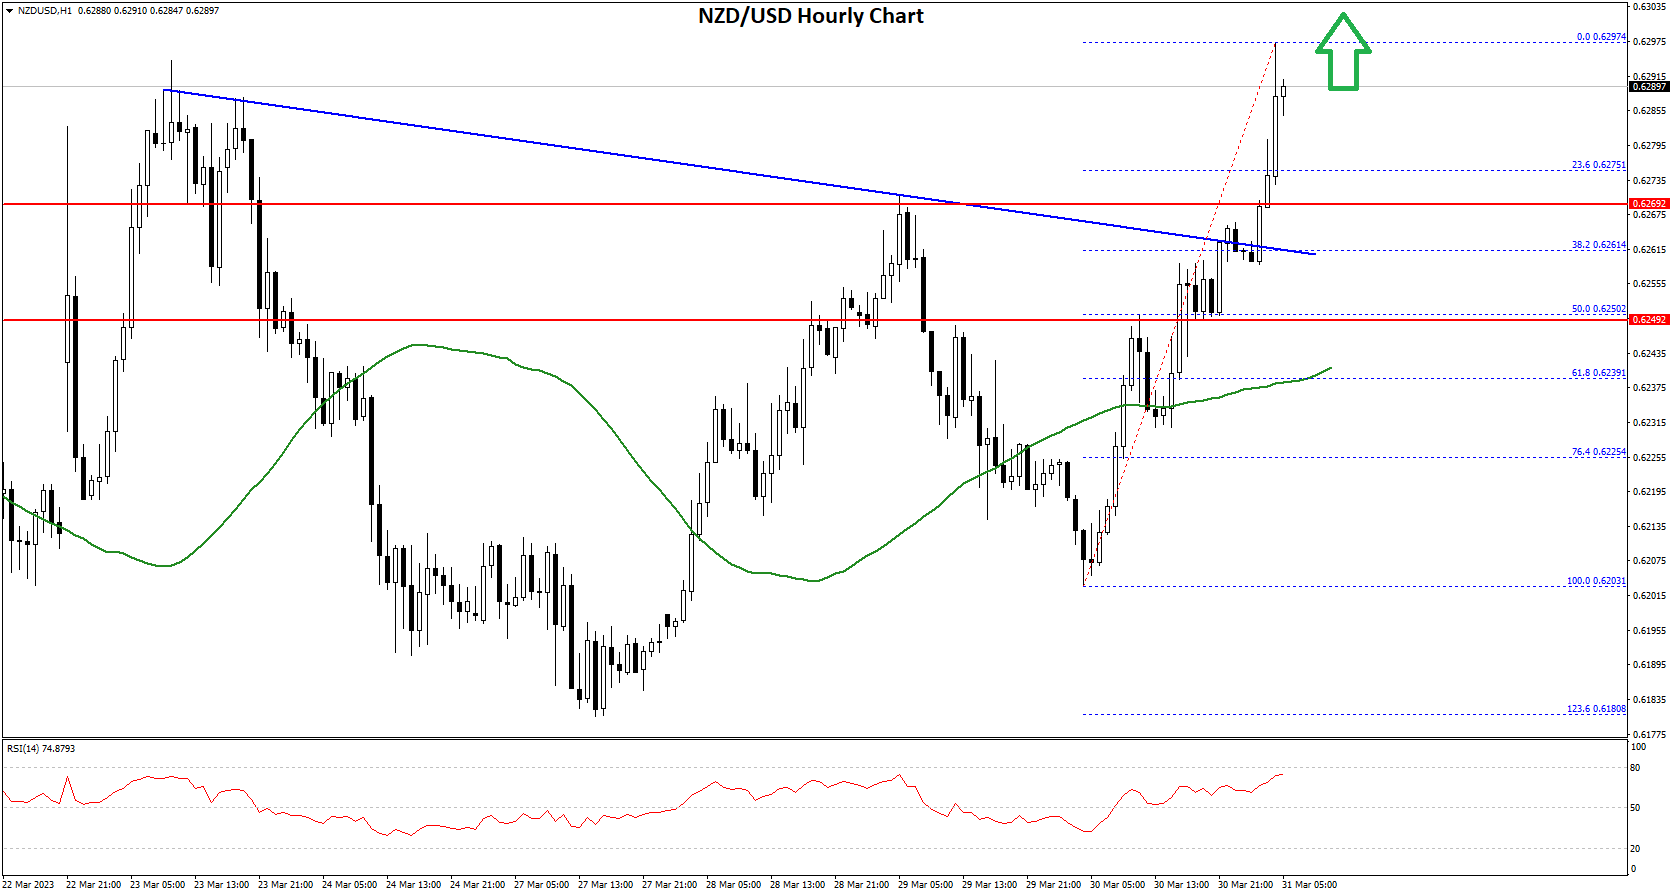
The pair even traded close to the 0.6300 level. A high is formed near 0.6297 and the pair is now consolidating gains. An immediate support is near the 0.6275 level. It is near the 23.6% Fib retracement level of the recent increase from the 0.6203 swing low to 0.6297 high.
The next support could be the 0.6260 zone. If there is a downside break below the 0.6260 support, the pair could extend its decline.
In the stated case, the pair may perhaps decline towards the 0.6240 support level or the 61.8% Fib retracement level of the recent increase from the 0.6203 swing low to 0.6297 high. Any more losses could set the pace for a test of the 0.6200 level.
On the upside, an initial resistance is near the 0.6295 level. The next major resistance is near the 0.6300 level. A clear move above the 0.6300 level might even push the pair towards the 0.6340 level. Any more gains might open the doors for a move towards the 0.6400 resistance zone in the coming days.
This forecast represents FXOpen Companies opinion only, it should not be construed as an offer, invitation or recommendation in respect to FXOpen Companies products and services or as financial advice.
Trade over 50 forex markets 24 hours a day with FXOpen. Take advantage of low commissions, deep liquidity, and spreads from 0.0 pips (additional fees may apply). Open your FXOpen account now or learn more about trading forex with FXOpen.
This article represents the opinion of the Companies operating under the FXOpen brand only. It is not to be construed as an offer, solicitation, or recommendation with respect to products and services provided by the Companies operating under the FXOpen brand, nor is it to be considered financial advice.
Stay ahead of the market!
Subscribe now to our mailing list and receive the latest market news and insights delivered directly to your inbox.


Latest articles

NZD/USD Analysis: A Tug-of-War at the Critical Level
The kiwi has strengthened meaningfully against most peers this month. However, against the US dollar specifically, NZD/USD remains well below its 2026 highs, trading in the mid-0.58 area versus January's peak near 0.6075.
New Zealand's Q2 inflation

AUD/USD and USD/CAD React to Rising Geopolitical Risks
Commodity-linked currencies remain under pressure as geopolitical tensions in the Middle East continue to escalate. The United States has maintained strikes on targets in Iran, while the Tehran-backed Houthis have intensified threats to shipping in the Red Sea and near

GBP/CHF: Trendline or RSI — Which One Is Lying?
Sterling enters this week on firmer footing, with political uncertainty fading fast after Andy Burnham's confirmation as Labour leader eased investor concerns over the succession to Keir Starmer. Markets reacted further to reports pointing to Shabana Mahmood as the frontrunner