


AUD/USD And NZD/USD Could Resume Decline
FXOpen

AUD/USD is struggling to settle above the 0.7200 resistance zone and it could resume its decline. Similarly, NZD/USD is facing hurdles near 0.6550 and it might decline again.
Important Takeaways for AUD/USD and NZD/USD
- The Aussie Dollar started an upside correction from the 0.7140 support against the US Dollar.
- There was a break above a short-term bearish trend line with resistance near 0.7175 on the hourly chart of AUD/USD.
- NZD/USD is currently facing a strong hurdle near the 0.6550 and 0.6555 resistance levels.
- There is a key connecting bearish trend line forming with resistance near 0.6545 on the hourly chart of NZD/USD.
AUD/USD Technical Analysis
The Aussie Dollar started a major decline from the 0.7275 swing high against the US Dollar. The AUD/USD pair broke the 0.7200 support zone and a major bullish trend line to move into a bearish zone.
The pair even dived below 0.7180 before it found support near 0.7135. A swing low was formed near 0.7135 on FXOpen and the pair is currently correcting higher. There was a break above the 0.7150 and 0.7180 levels.
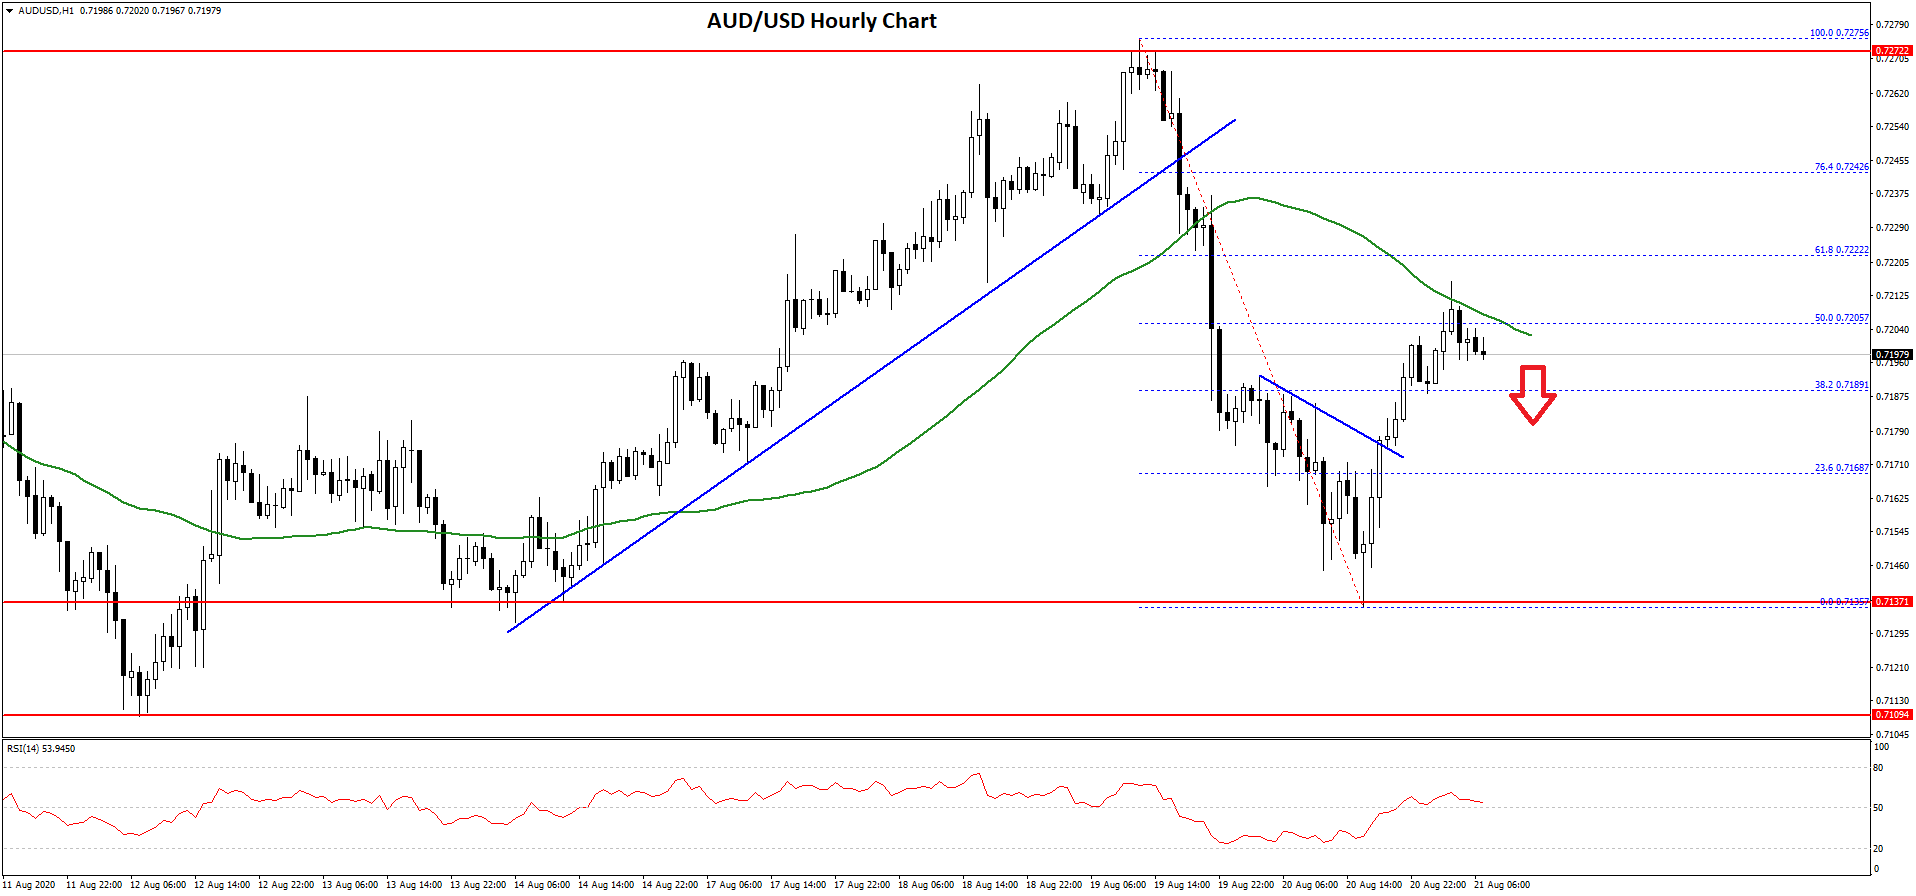
The pair even climbed above the 38.2% Fib retracement level of the key decline from the 0.7275 high to 0.7135 low. Moreover, there was a break above a short-term bearish trend line with resistance near 0.7175 on the hourly chart of AUD/USD.
However, the pair seems to be facing a strong resistance near the 0.7200 level and the 50 hourly simple moving average. It seems like the 50% Fib retracement level of the key decline from the 0.7275 high to 0.7135 low is also acting as a hurdle.
If there is no upside break and close above 0.7200, the pair is likely to resume its decline. An initial support is near the 0.7180, below which the bears are likely to aim a retest of 0.7140.
Conversely, the pair could break the 0.7200 barrier and settle nicely above the 50 hourly SMA. The next resistance could be 0.7220, above which AUD/USD might test 0.7250.
NZD/USD Technical Analysis
The New Zealand Dollar also followed a similar pattern after it declined sharply from the 0.6650 resistance zone against the US Dollar. The NZD/USD pair traded as low as 0.6488 and it is currently correcting higher.
There was a break above the 0.6500 and 0.6520 resistance levels. The pair also climbed above the 23.6% Fib retracement level of the main decline from the 0.6651 high to 0.6488 low.
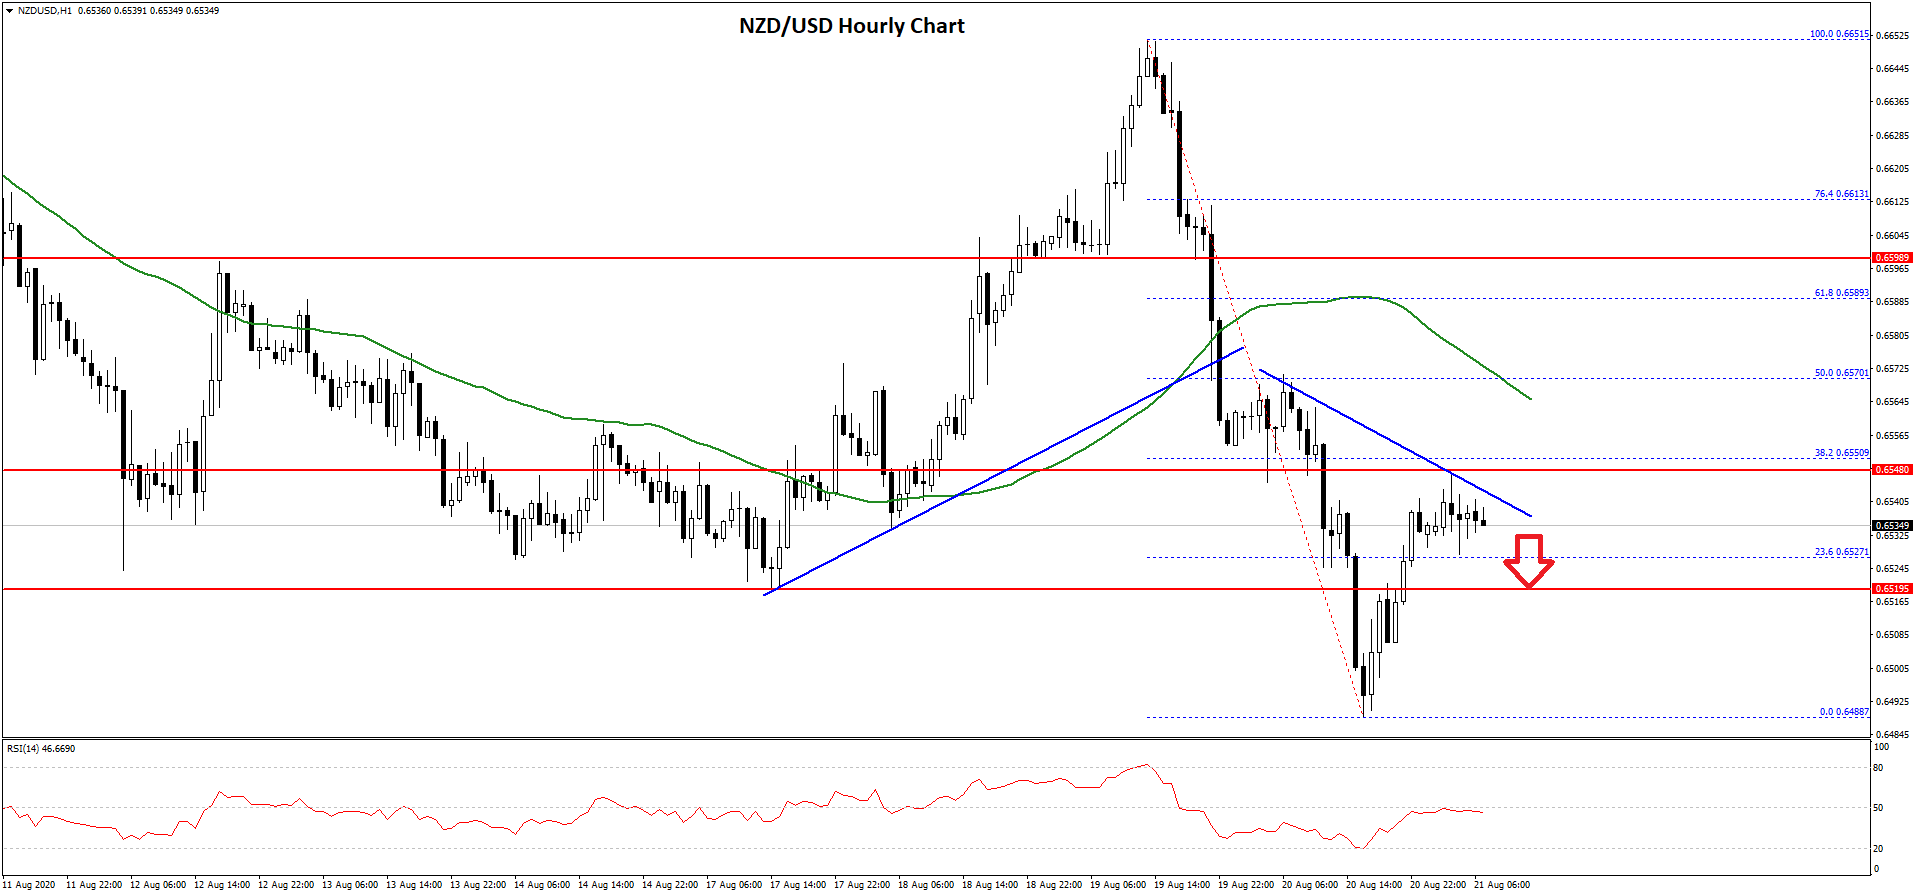
It is now facing a major resistance near the 0.6550 level. There is also a key connecting bearish trend line forming with resistance near 0.6545 on the hourly chart of NZD/USD. The trend line is close to the 38.2% Fib retracement level of the main decline from the 0.6651 high to 0.6488 low.
Above the trend line resistance, the next major resistance is near the 0.6570 level and the 50 hourly simple moving average. A close above the 0.6550 and 0.6570 levels might open the doors for a larger upward move.
On the downside, the 0.6520 level is an initial support for the bulls. The next major support is near the 0.6500 level. Any further losses may perhaps push it into a bearish zone towards the 0.6450 level.
Trade over 50 forex markets 24 hours a day with FXOpen. Take advantage of low commissions, deep liquidity, and spreads from 0.0 pips (additional fees may apply). Open your FXOpen account now or learn more about trading forex with FXOpen.
This article represents the opinion of the Companies operating under the FXOpen brand only. It is not to be construed as an offer, solicitation, or recommendation with respect to products and services provided by the Companies operating under the FXOpen brand, nor is it to be considered financial advice.
Stay ahead of the market!
Subscribe now to our mailing list and receive the latest market news and insights delivered directly to your inbox.


Latest articles

EUR/USD Eyes Gains As USD/CHF Weakness Deepens Again
EUR/USD started a fresh increase above 1.1700 and 1.1720. USD/CHF declined further and is now struggling below 0.7835.
Important Takeaways for EUR/USD and USD/CHF Analysis Today
· The Euro started a decent increase from

Apple: Earnings Day Above the Activity Zone
On 30 April, after the market close, Apple Inc. will release its financial results for the second quarter of fiscal 2026. The consensus forecast, based on estimates from 31 analysts, points to revenue of around $109.7 billion, with expected

USD/JPY and USD/CHF Near Key Levels: The Dollar Supported by the Fed
The US dollar continues to trend upwards following the Federal Reserve meeting, drawing support from the regulator’s moderately hawkish stance and comments by Jerome Powell. Markets interpret the Fed’s rhetoric as a signal that restrictive policy is likely