


AUD/USD and NZD/USD Eye Additional Gains
FXOpen
AUD/USD is gaining pace above the 0.6950 resistance. NZD/USD is also eyeing a key upside break above the 0.6300 resistance.
Important Takeaways for AUD/USD and NZD/USD
· The Aussie Dollar started a fresh increase above the 0.6880 resistance zone against the US Dollar.
· There is a key bullish trend line forming with support near 0.6955 on the hourly chart of AUD/USD.
· NZD/USD also started a major increase from the 0.6200 support zone.
· There was a break above a major bearish trend line with resistance near 0.6240 on the hourly chart of NZD/USD.
AUD/USD Technical Analysis
The Aussie Dollar formed a base above the 0.6820 and 0.6850 levels against the US Dollar. The AUD/USD pair started a steady increase after it cleared the 0.6900 resistance zone.
There was a clear move above the 0.6950 resistance and the 50 hourly simple moving average. The pair even broke the 0.7000 barrier and traded as high as 0.7014 on FXOpen. Recently, there was a minor downside correction below the 0.7000 level.
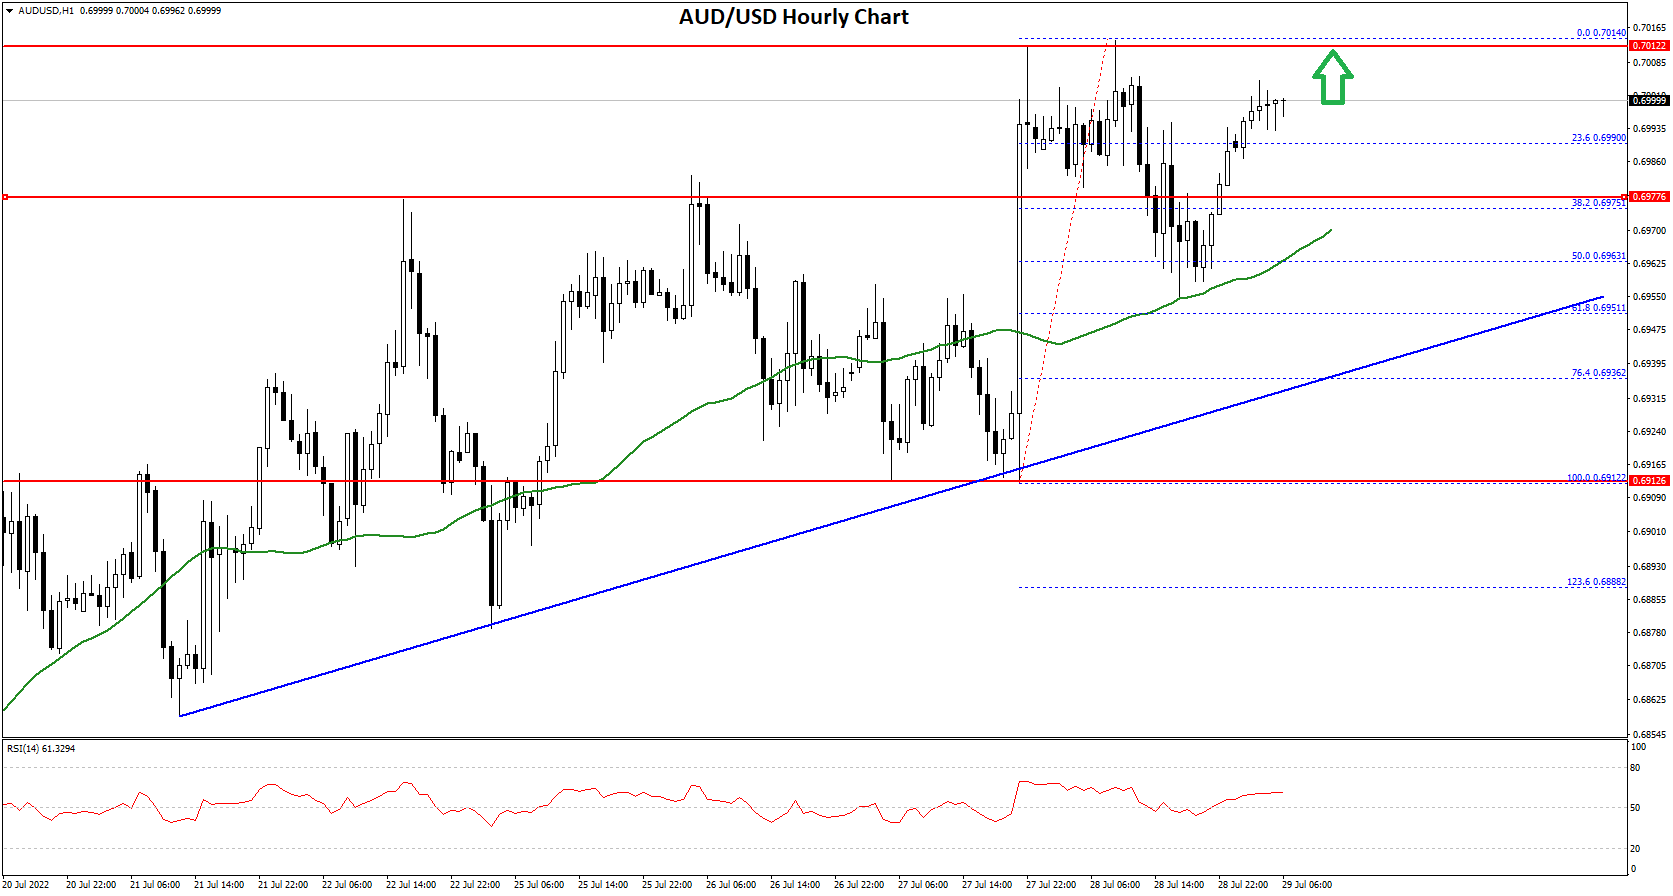
The pair dipped below the 38.2% Fib retracement level of the upward move from the 0.6912 swing low to 0.7014 high. However, the pair stayed above the 0.6960 level and the 50 hourly simple moving average.
The 50% Fib retracement level of the upward move from the 0.6912 swing low to 0.7014 high also acted as a support. The pair is now rising and trading near 0.7000.
On the upside, the AUD/USD pair is facing resistance near the 0.7000 level. The next major resistance is near the 0.7020 level. A close above the 0.7020 level could start a steady increase in the near term. The next major resistance could be 0.7080.
On the downside, an initial support is near the 0.6970 level. The next support could be the 0.6950 level. There is also a key bullish trend line forming with support near 0.6955 on the hourly chart of AUD/USD. If there is a downside break below the 0.6950 support, the pair could extend its decline towards the 0.6880 level.
NZD/USD Technical Analysis
The New Zealand Dollar also followed a similar path from the 0.6200 zone against the US Dollar. The NZD/USD pair traded above the 0.6250 resistance to enter a positive zone.
There was a clear move above the 0.6280 resistance and the 50 hourly simple moving average. Besides, there was a break above a major bearish trend line with resistance near 0.6240 on the hourly chart of NZD/USD.
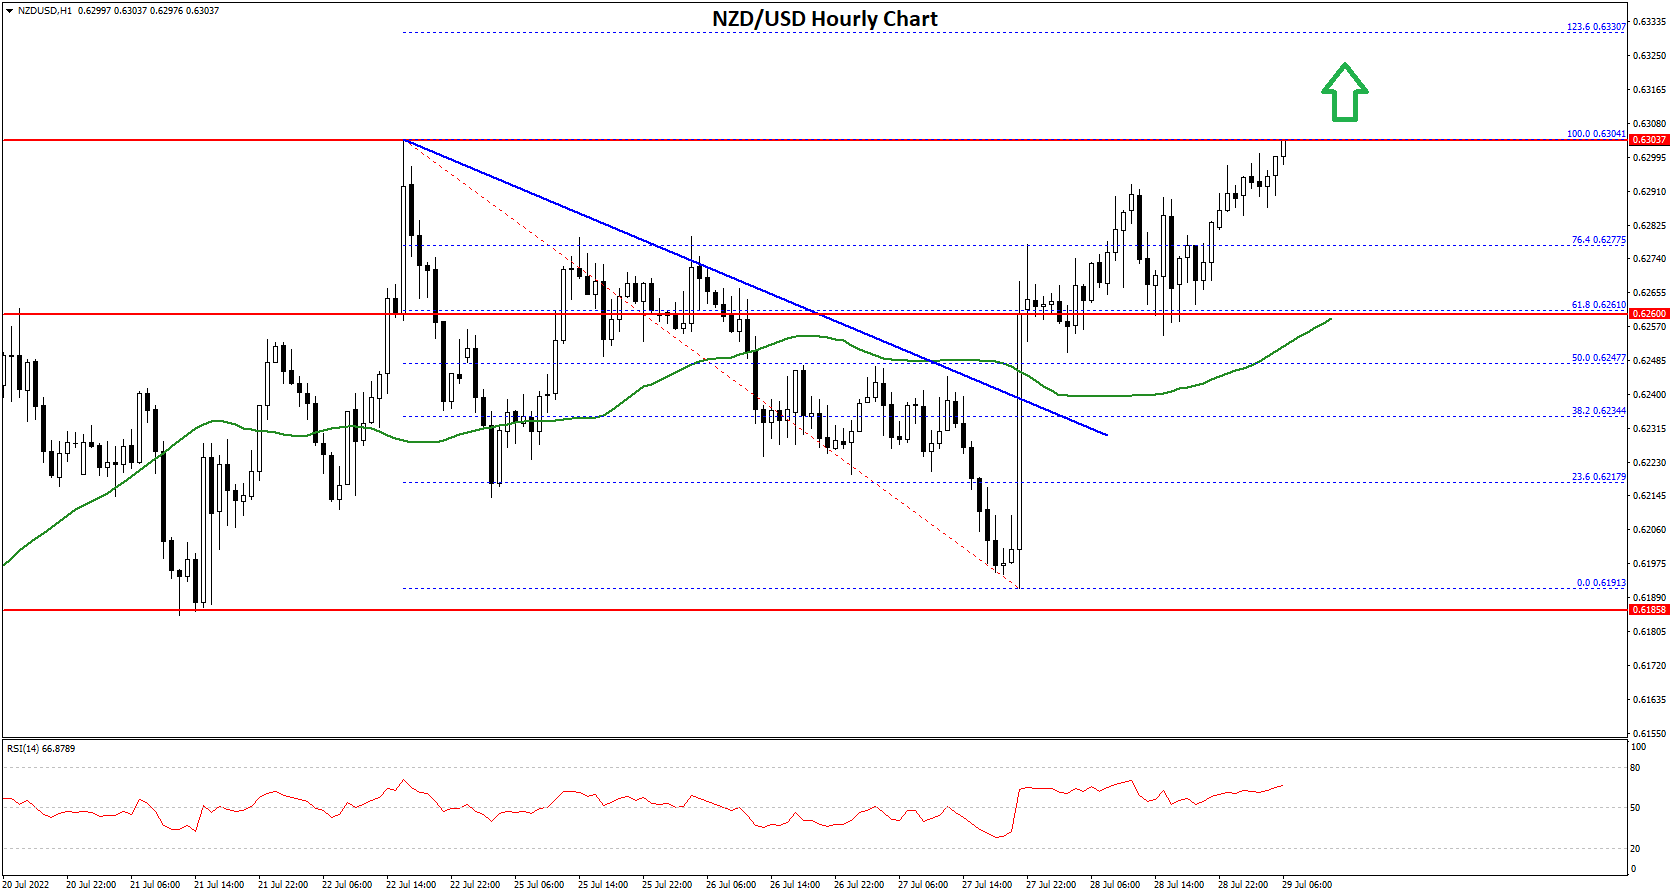
The pair cleared the 61.8% Fib retracement level of the downward move from the 0.6304 swing high to 0.6191 low. It is now trading near the 0.6300 resistance zone.
On the upside, an initial resistance is near the 0.6315 level. The next major resistance is near the 0.6330 level. It is near the 1.236 Fib extension level of the downward move from the 0.6304 swing high to 0.6191 low.
A clear move above the 0.6330 level might even push the pair towards the 0.6380 level. If not, the pair might correct lower. On the downside, an initial support is near the 0.6280 level.
The next support could be the 0.6250 zone. If there is a downside break below the 0.6250 support, the pair could extend its decline towards the 0.6200 level.
This forecast represents FXOpen Markets Limited opinion only, it should not be construed as an offer, invitation or recommendation in respect to FXOpen Markets Limited products and services or as financial advice.
Trade over 50 forex markets 24 hours a day with FXOpen. Take advantage of low commissions, deep liquidity, and spreads from 0.0 pips (additional fees may apply). Open your FXOpen account now or learn more about trading forex with FXOpen.
This article represents the opinion of the Companies operating under the FXOpen brand only. It is not to be construed as an offer, solicitation, or recommendation with respect to products and services provided by the Companies operating under the FXOpen brand, nor is it to be considered financial advice.
Stay ahead of the market!
Subscribe now to our mailing list and receive the latest market news and insights delivered directly to your inbox.


Latest articles

Silver Attempts to Break Out of Its Range
Silver continues to balance between its dual role as an industrial metal and so-called refuge asset, and this combination largely explains the lack of a clear trend in recent weeks. Shifting expectations for central bank interest rates can influence the

Nasdaq 100: Is This the Correction Traders Have Been Waiting For?
The Nasdaq 100 (US Tech 100 Mini on FXOpen) remains caught between two opposing forces: cooling inflation on one side, and persistent geopolitical instability on the other. On 14 July, June's CPI print came in softer than expected, easing near-term

XRP/USD: Symmetrical Triangle Forms as Trading Volume Fades
On 6 July, Ripple received a full Crypto-Asset Service Provider (CASP) licence under the Markets in Crypto-Assets (MiCA) regulation from Luxembourg's financial regulator, the CSSF. The approval allows the company to offer regulated crypto payment services across all 30 countries