


AUD/USD and NZD/USD Eyes Sustained Move Higher
FXOpen

AUD/USD started a fresh increase above the 0.6680 resistance zone. NZD/USD is rising and might aim a move above the 0.6250 resistance.
Important Takeaways for AUD/USD and NZD/USD
· The Aussie Dollar started a fresh increase above the 0.6650 resistance against the US Dollar.
· There is a key bullish trend line forming with support near 0.6680 on the hourly chart of AUD/USD.
· NZD/USD started a decent increase above the 0.6200 resistance zone.
· There is a major bullish trend line forming with support near 0.6180 on the hourly chart of NZD/USD.
AUD/USD Technical Analysis
The Aussie Dollar found support near 0.6590 and started a decent increase against the US Dollar. The AUD/USD pair gained pace for a move above the 0.6620 resistance.
The pair even moved above the 0.6650 level and the 50 hourly simple moving average. There was a clear move above the 61.8% Fib retracement level of the downward move from the 0.6711 swing high to 0.6589 low.
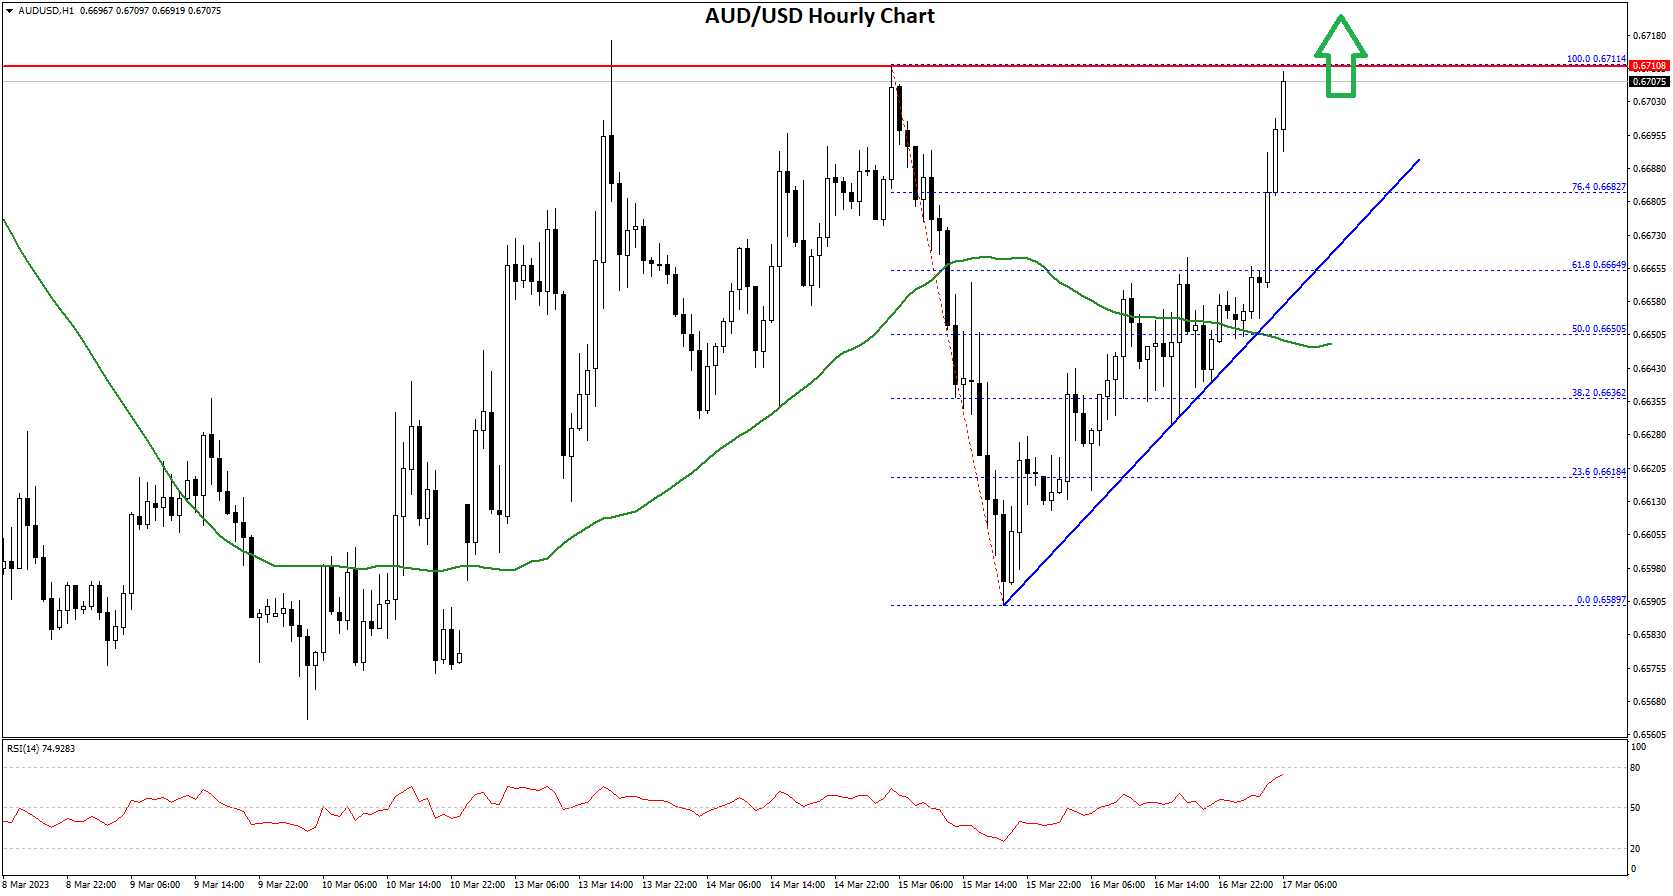
It is now trading above the 0.6700 level, plus above the 76.4% Fib retracement level of the downward move from the 0.6711 swing high to 0.6589 low.
On the upside, the AUD/USD pair is facing resistance near the 0.6710 level. The next major resistance is near the 0.6740 level. A close above the 0.6740 level could start another steady increase in the near term. The next major resistance could be 0.6800.
On the downside, an initial support is near the 0.6685 level. There is also a key bullish trend line forming with support near 0.6680 on the hourly chart of AUD/USD.
The next support could be the 0.6650 level and the 50 hourly simple moving average. If there is a downside break below the 0.6650 support, the pair could extend its decline towards the 0.6600 level.
NZD/USD Technical Analysis
The New Zealand Dollar started a decent increase from the 0.6140 support zone against the US Dollar. The NZD/USD pair climbed above the 0.6180 and 0.6200 resistance levels.
The bulls pushed the pair above the 0.6220 level and the 50 hourly simple moving average. The pair climbed above the 61.8% Fib retracement level of the downward move from the 0.6264 swing high to 0.6140 low.
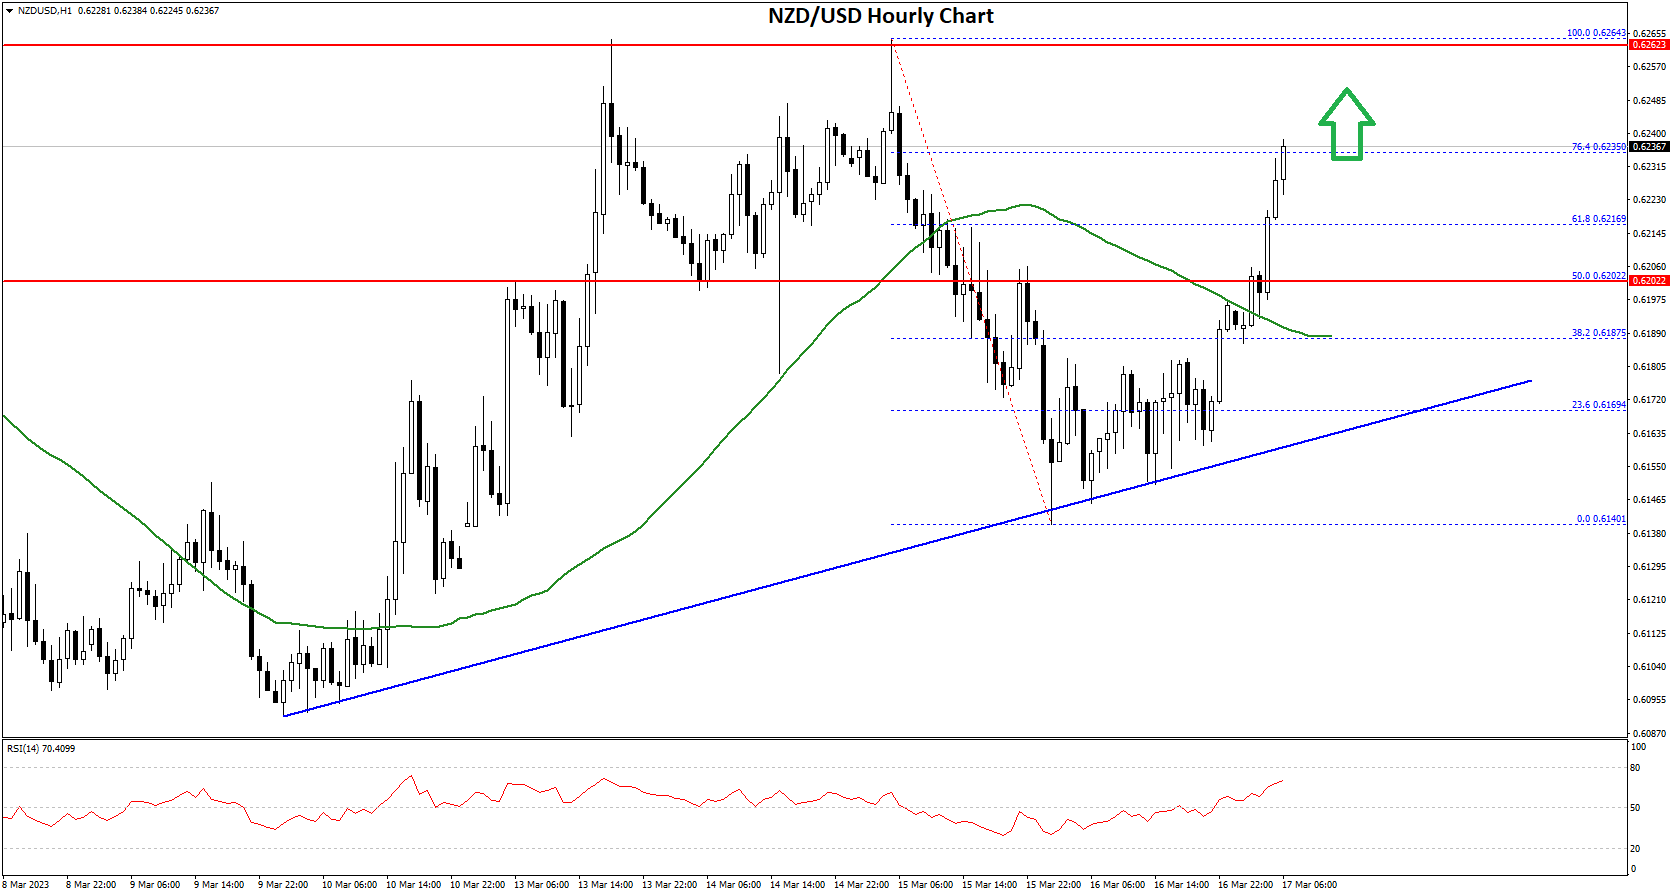
It is now testing the 0.6235 level, plus the 76.4% Fib retracement level of the downward move from the 0.6264 swing high to 0.6140 low.
On the upside, an initial resistance is near the 0.6240 level. The next major resistance is near the 0.6265 level. A clear move above the 0.6265 level might even push the pair towards the 0.6300 level. Any more gains might open the doors for a move towards the 0.6320 resistance zone in the coming days.
An immediate support is near the 0.6200 level. The next support could be the 0.6180 zone. There is also a major bullish trend line forming with support near 0.6180 on the hourly chart of NZD/USD. If there is a downside break below the 0.6180 support, the pair could extend its decline.
In the stated case, the pair may perhaps decline towards the 0.6120 support level. Any more losses could set the pace for a test of the 0.6100 level.
This forecast represents FXOpen Companies opinion only, it should not be construed as an offer, invitation or recommendation in respect to FXOpen Companies products and services or as financial advice.
Trade over 50 forex markets 24 hours a day with FXOpen. Take advantage of low commissions, deep liquidity, and spreads from 0.0 pips (additional fees may apply). Open your FXOpen account now or learn more about trading forex with FXOpen.
This article represents the opinion of the Companies operating under the FXOpen brand only. It is not to be construed as an offer, solicitation, or recommendation with respect to products and services provided by the Companies operating under the FXOpen brand, nor is it to be considered financial advice.
Stay ahead of the market!
Subscribe now to our mailing list and receive the latest market news and insights delivered directly to your inbox.


Latest articles

Weekly Market Insights with Gary Thomson: The Week of Central Banks and Earnings
In this video, we’ll explore the key economic events and market trends, shaping the financial landscape. Get ready for insights into financial markets to help you navigate the week ahead. Let’s dive in!
In this episode of Market

Intel at a Crossroads: Earnings Beat Meets Technical Resistance
Intel has just delivered its strongest quarter in over fifteen years, and the market reaction says it all. Q2 2026 revenue surged 25% year-over-year to $16.1 billion, crushing the consensus estimate of $14.42 billion, while adjusted EPS of

Tesla: Complex Range Structure Breaks Down Following Quarterly Earnings
Tesla released its Q2 2026 results after the market closed on 22 July. Revenue increased 26% year-on-year to $28.24 billion, while vehicle deliveries reached a record 480,126 units. However, operating margin fell sharply to 1.4%, down from