


AUD/USD and NZD/USD Facing Key Hurdles
FXOpen

AUD/USD started a decent recovery from the 0.7000 support, but it is facing hurdles. NZD/USD is also correcting higher, but it must clear 0.6650 for more gains.
Important Takeaways for AUD/USD and NZD/USD
- The Aussie Dollar traded as low as 0.7002 before starting an upside correction against the US Dollar.
- There was a break above a short-term bearish trend line with resistance near 0.7040 on the hourly chart of AUD/USD.
- NZD/USD also started a decent recovery wave from the 0.6596 low.
- There is a key bearish trend line forming with resistance near 0.6645 on the hourly chart of NZD/USD.
AUD/USD Technical Analysis
In the past few sessions, the Aussie Dollar declined and traded below the 0.7120 support against the US Dollar. The AUD/USD pair broke many supports near 0.7050 to move further into a bearish zone.
It traded as low as 0.7002 FXOpen recently and it is currently correcting higher. There was a break above the 0.7020 resistance level, plus it traded above the 50% Fib retracement level of the recent decline from the 0.7076 high to 0.7002 low.

There was a break above a short-term bearish trend line with resistance near 0.7040 on the hourly chart of AUD/USD. The pair is now trading above the 0.7040 zone.
An initial resistance is near the 0.7060 and the 50 hourly simple moving average. The 76.4% Fib retracement level of the recent decline from the 0.7076 high to 0.7002 low is also near the 0.7060 zone to act as a major resistance.
Therefore, the pair must break the 0.7060 resistance and settled above the 50 hourly simple moving average to start a fresh increase in the near term. The next stop for the bulls could be 0.7100 or 0.7120.
On the downside, the 0.7030 and 0.7020 are immediate support levels. Any further losses may perhaps open the doors for more losses towards the 0.7000 support or even 0.6975 in the near term.
NZD/USD Technical Analysis
The New Zealand Dollar failed to surpass the 0.6725 level and started a fresh decline against the US Dollar. The NZD/USD pair broke the 0.6680 support level to move into a bearish zone.
The decline gained pace below 0.6660 and the 50 hourly simple moving average. It even spiked below the 0.6600 support and traded as low as 0.6596.
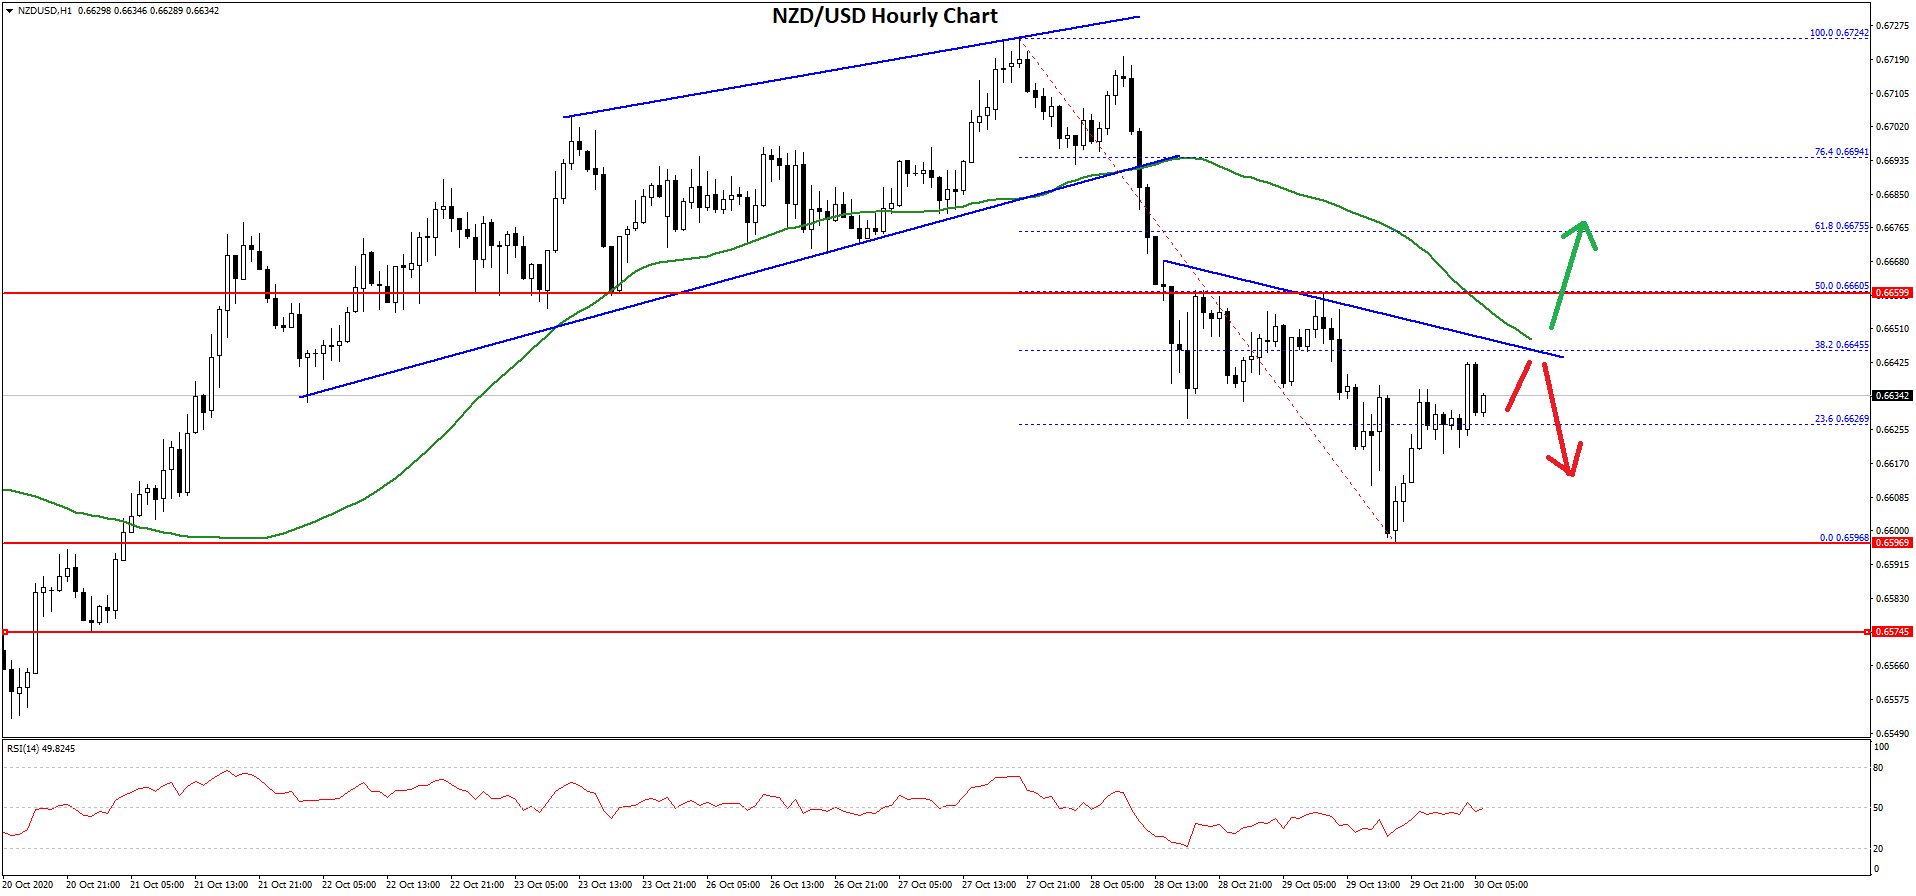
The pair is currently correcting higher above 0.6620. However, it is facing hurdles near 0.6645, the 50 hourly simple moving average, and the 23.6% Fib retracement level of the recent decline from the 0.6724 high to 0.6596 low.
There is also a key bearish trend line forming with resistance near 0.6645 on the hourly chart of NZD/USD. A clear break above the trend line resistance is needed for a push towards the 0.6660 resistance. It is close to the 50% Fib retracement level of the recent decline from the 0.6724 high to 0.6596 low.
Therefore, the pair must settle above 0.6645, 0.6660, and the 50 hourly SMA to move back into a positive zone. The next major resistance is seen near the 0.6700 level.
If there is no upside break above 0.6645 or 0.6660, the pair is likely to continue lower. An initial support is near the 0.6620 level. A clear break below the 0.6620 support could lead the NZD/USD pair towards the 0.6600 support.
Trade over 50 forex markets 24 hours a day with FXOpen. Take advantage of low commissions, deep liquidity, and spreads from 0.0 pips (additional fees may apply). Open your FXOpen account now or learn more about trading forex with FXOpen.
This article represents the opinion of the Companies operating under the FXOpen brand only. It is not to be construed as an offer, solicitation, or recommendation with respect to products and services provided by the Companies operating under the FXOpen brand, nor is it to be considered financial advice.
Stay ahead of the market!
Subscribe now to our mailing list and receive the latest market news and insights delivered directly to your inbox.


Latest articles

Weekly Market Insights with Gary Thomson: The Week of Central Banks and Earnings
In this video, we’ll explore the key economic events and market trends, shaping the financial landscape. Get ready for insights into financial markets to help you navigate the week ahead. Let’s dive in!
In this episode of Market

Intel at a Crossroads: Earnings Beat Meets Technical Resistance
Intel has just delivered its strongest quarter in over fifteen years, and the market reaction says it all. Q2 2026 revenue surged 25% year-over-year to $16.1 billion, crushing the consensus estimate of $14.42 billion, while adjusted EPS of

Tesla: Complex Range Structure Breaks Down Following Quarterly Earnings
Tesla released its Q2 2026 results after the market closed on 22 July. Revenue increased 26% year-on-year to $28.24 billion, while vehicle deliveries reached a record 480,126 units. However, operating margin fell sharply to 1.4%, down from