


AUD/USD and NZD/USD Gain Bullish Momentum
FXOpen

AUD/USD is gaining pace above the 0.7050 resistance. NZD/USD is also eyeing a key upside break above the 0.6460 resistance.
Important Takeaways for AUD/USD and NZD/USD
· The Aussie Dollar started a fresh increase above the 0.7000 resistance zone against the US Dollar.
· There is a key bullish trend line forming with support near 0.7100 on the hourly chart of AUD/USD.
· NZD/USD also started a major increase from the 0.6220 support zone.
· There is a connecting bullish trend line forming with support near 0.6440 on the hourly chart of NZD/USD.
AUD/USD Technical Analysis
The Aussie Dollar formed a base above the 0.6920 and 0.6950 levels against the US Dollar. The AUD/USD pair started a steady increase after it cleared the 0.7000 resistance zone.
There was a clear move above the 0.7050 resistance and the 50 hourly simple moving average. The pair even broke the 0.7100 barrier and traded as high as 0.7136 on FXOpen. Recently, there was a minor downside correction below the 0.7120 level.
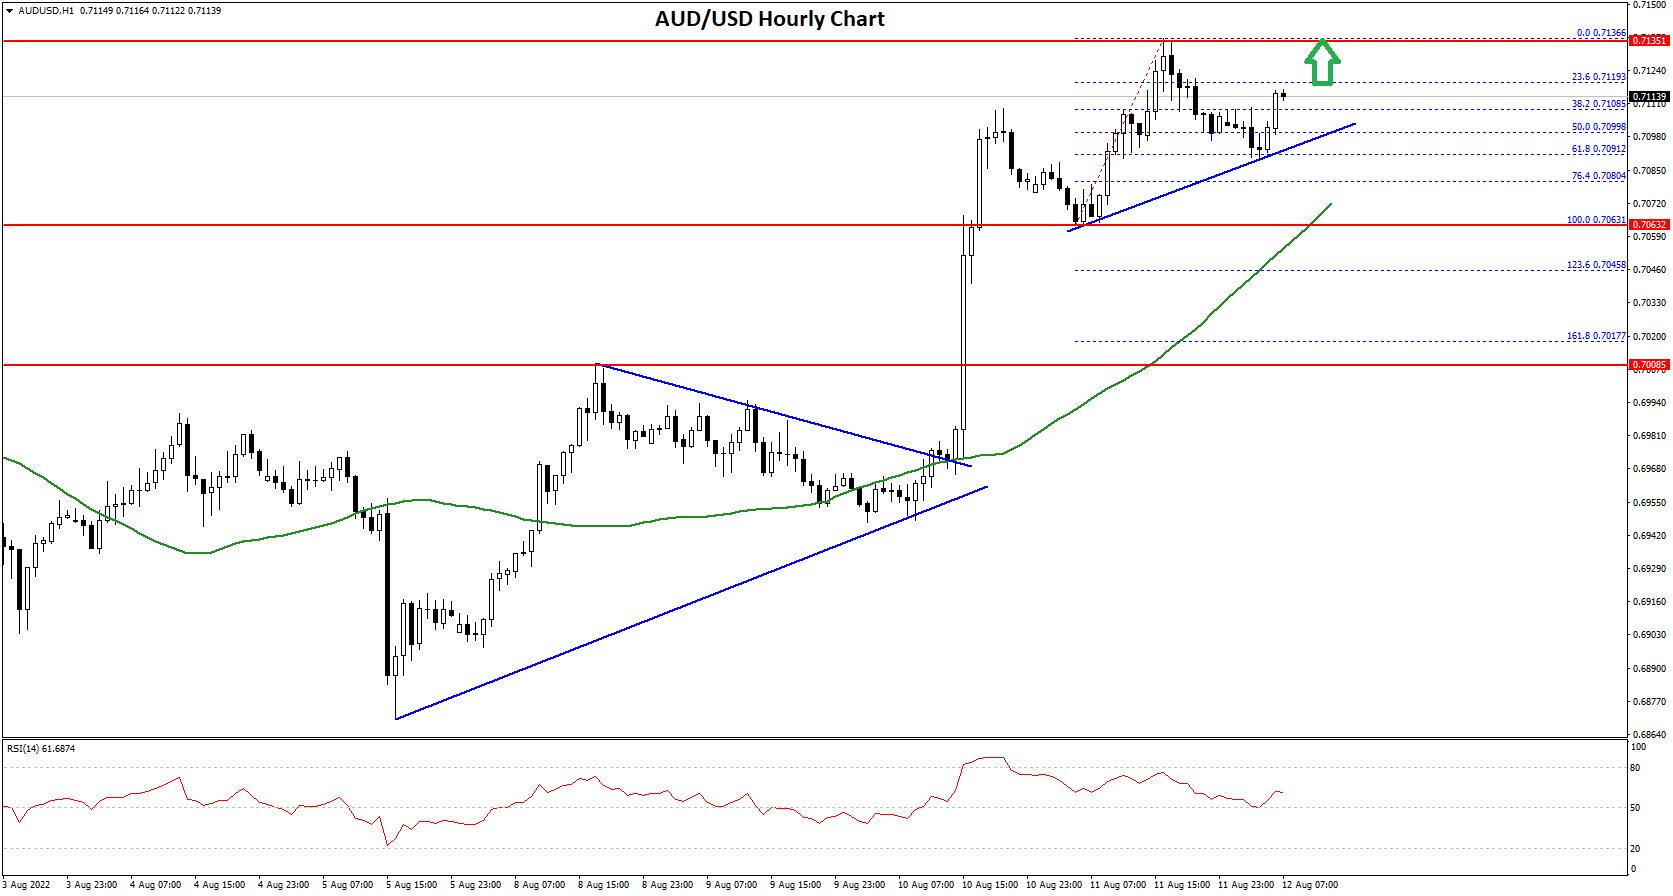
The pair dipped below the 50% Fib retracement level of the upward move from the 0.7063 swing low to 0.7136 high. However, the pair stayed above the 0.7100 level and the 50 hourly simple moving average.
The 61.8% Fib retracement level of the upward move from the 0.7063 swing low to 0.7136 high also acted as a support. The pair is now rising and trading near 0.7115.
There is also a key bullish trend line forming with support near 0.7100 on the hourly chart of AUD/USD. On the upside, the AUD/USD pair is facing resistance near the 0.7135 level. The next major resistance is near the 0.7150 level. A close above the 0.7150 level could start a steady increase in the near term. The next major resistance could be 0.7200.
On the downside, an initial support is near the 0.7100 level. The next support could be the 0.7070 level. If there is a downside break below the 0.7070 support, the pair could extend its decline towards the 0.7020 level.
NZD/USD Technical Analysis
The New Zealand Dollar also followed a similar path from the 0.6220 zone against the US Dollar. The NZD/USD pair traded above the 0.6300 resistance to enter a positive zone.
There was a clear move above the 0.6350 resistance and the 50 hourly simple moving average. The pair even cleared the 0.4400 resistance and traded as high as 0.6462. Recently, there was a minor downside correction below the 0.6450 level.
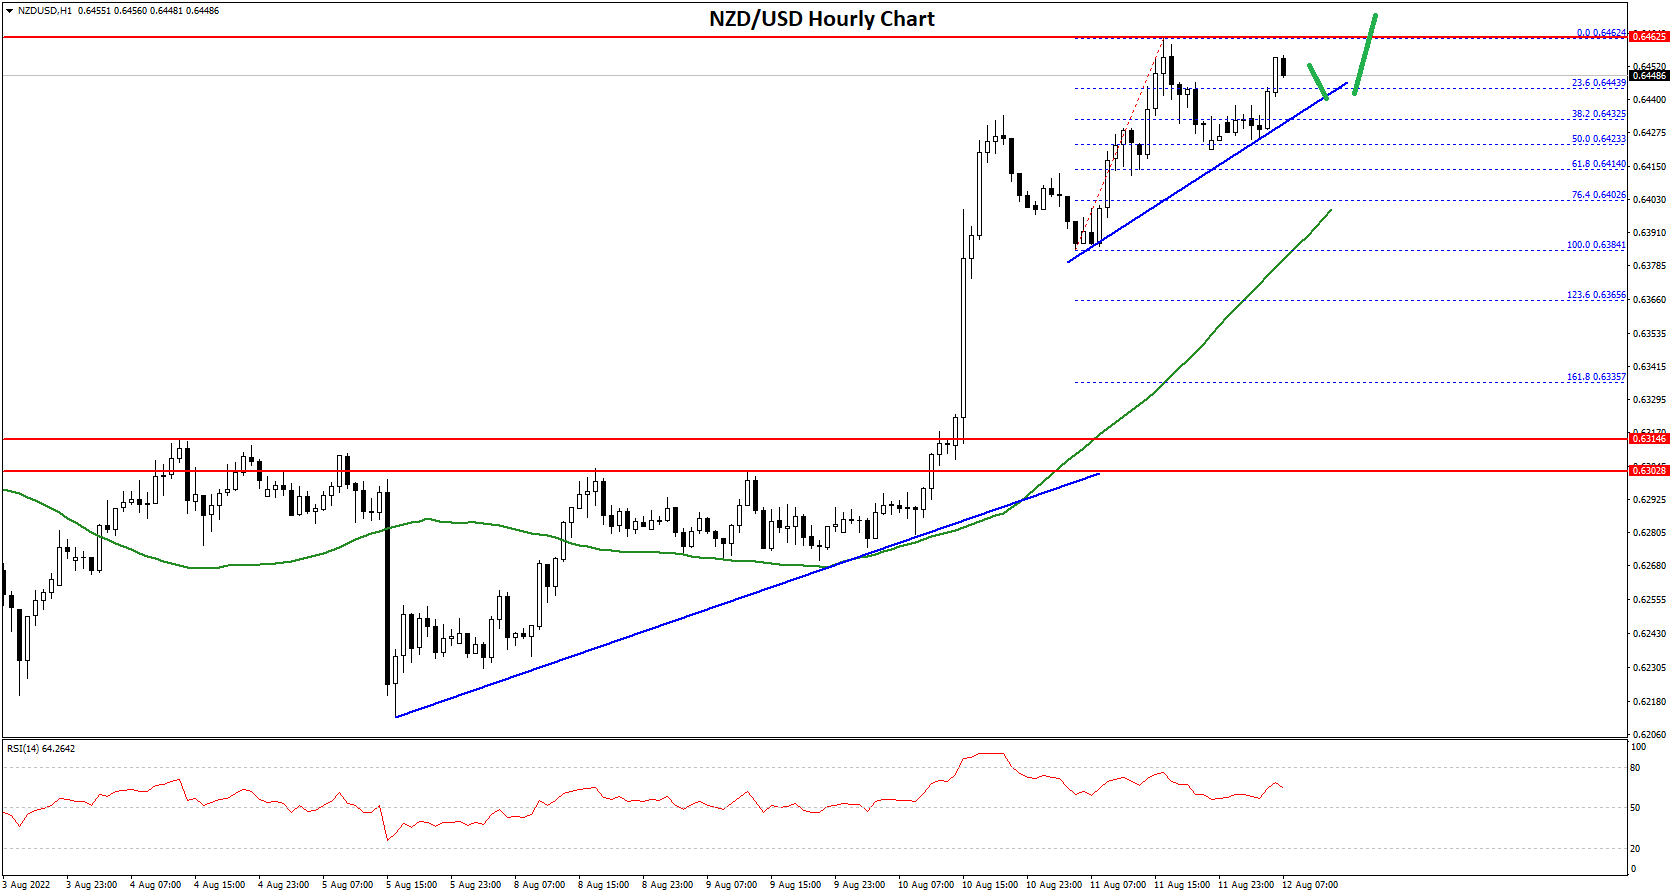
The pair dipped below the 38.2% Fib retracement level of the upward move from the 0.6384 swing low to 0.6462 high. However, the pair stayed above the 0.6420 level and the 50 hourly simple moving average.
The pair stayed above the 50% Fib retracement level of the upward move from the 0.6384 swing low to 0.6462 high. There is also a connecting bullish trend line forming with support near 0.6440 on the hourly chart of NZD/USD.
On the upside, an initial resistance is near the 0.6460 level. The next major resistance is near the 0.6450 level. A clear move above the 0.6450 level might even push the pair towards the 0.6500 level.
If not, the pair might correct lower below 0.6440. On the downside, an initial support is near the 0.6430 level. The next support could be the 0.6400 zone. If there is a downside break below the 0.6400 support, the pair could extend its decline towards the 0.6350 level.
This forecast represents FXOpen Markets Limited opinion only, it should not be construed as an offer, invitation or recommendation in respect to FXOpen Markets Limited products and services or as financial advice.
Trade over 50 forex markets 24 hours a day with FXOpen. Take advantage of low commissions, deep liquidity, and spreads from 0.0 pips (additional fees may apply). Open your FXOpen account now or learn more about trading forex with FXOpen.
This article represents the opinion of the Companies operating under the FXOpen brand only. It is not to be construed as an offer, solicitation, or recommendation with respect to products and services provided by the Companies operating under the FXOpen brand, nor is it to be considered financial advice.
Stay ahead of the market!
Subscribe now to our mailing list and receive the latest market news and insights delivered directly to your inbox.


Latest articles

Weekly Market Insights with Gary Thomson: The Week of Central Banks and Earnings
In this video, we’ll explore the key economic events and market trends, shaping the financial landscape. Get ready for insights into financial markets to help you navigate the week ahead. Let’s dive in!
In this episode of Market

Intel at a Crossroads: Earnings Beat Meets Technical Resistance
Intel has just delivered its strongest quarter in over fifteen years, and the market reaction says it all. Q2 2026 revenue surged 25% year-over-year to $16.1 billion, crushing the consensus estimate of $14.42 billion, while adjusted EPS of

Tesla: Complex Range Structure Breaks Down Following Quarterly Earnings
Tesla released its Q2 2026 results after the market closed on 22 July. Revenue increased 26% year-on-year to $28.24 billion, while vehicle deliveries reached a record 480,126 units. However, operating margin fell sharply to 1.4%, down from