


FXOpen

AUD/USD rallied recently and climbed above the key 0.6200 resistance area. Similarly, NZD/USD is gaining bullish momentum and trading nicely above the 0.6000 area.
Important Takeaways for AUD/USD and NZD/USD
- The Aussie Dollar started a strong rise above the 0.6100 and 0.6200 resistance levels against the US Dollar.
- There is a major bullish trend line forming with support near 0.6275 on the hourly chart of AUD/USD.
- NZD/USD is surging and it is now trading well above the 0.6000 handle.
- There is a key bullish trend line forming with support near 0.6050 on the hourly chart of NZD/USD.
AUD/USD Technical Analysis
The Aussie Dollar formed a strong support base above the 0.6000 level and recently started a solid upward move against the US Dollar. The AUD/USD pair broke the key 0.6200 resistance to move into a positive zone.
Moreover, there was a close above the 0.6250 level and the 50 hourly simple moving average. It opened the doors for more gains above the 0.6300 level.
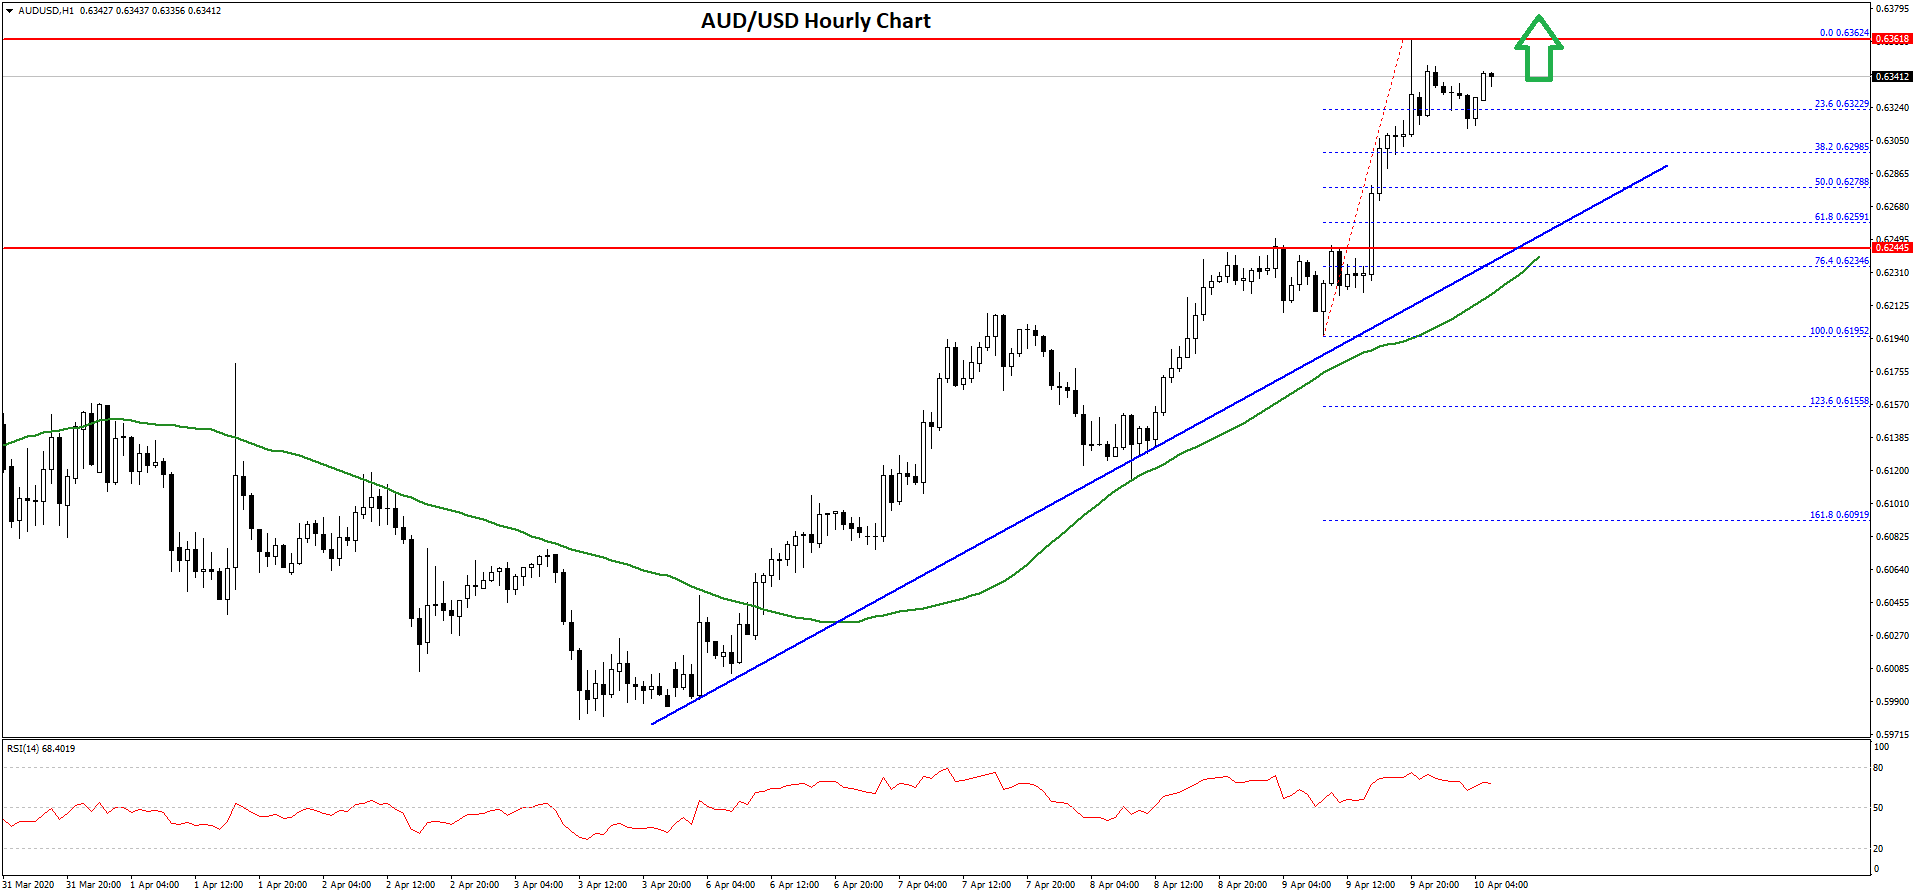
The pair traded as high as 0.6362 on FXOpen and it is currently consolidating gains. It tested the 23.6% Fib retracement level of the recent wave from the 0.6195 low to 0.6362 high.
On the downside, the first key support is near the 0.6300 level. The next major support is near the 0.6275 level. There is also major bullish trend line forming with support near 0.6275 on the hourly chart of AUD/USD.
The trend line is close to the 50% Fib retracement level of the recent wave from the 0.6195 low to 0.6362 high. Therefore, the pair is likely to remain well bid above the 0.6300 and 0.6275 levels. Any further losses may perhaps lead the pair towards 0.6200.
On the upside, an initial resistance is near the 0.6350 level. A successful close above the 0.6350 level could open the doors for another lift-off and the pair might surge towards the 0.6400 and 0.6440 resistance levels in the near term.
NZD/USD Technical Analysis
The New Zealand Dollar also followed a similar pattern and started a strong increase from the 0.5865 support area against the US Dollar. The NZD/USD broke the main 0.6000 resistance area to move back into a positive zone.
The upward move was such that the pair even traded above the 0.6050 level and settled well above the 50 hourly simple moving average. It traded as high as 0.6095 and it is currently correcting lower.
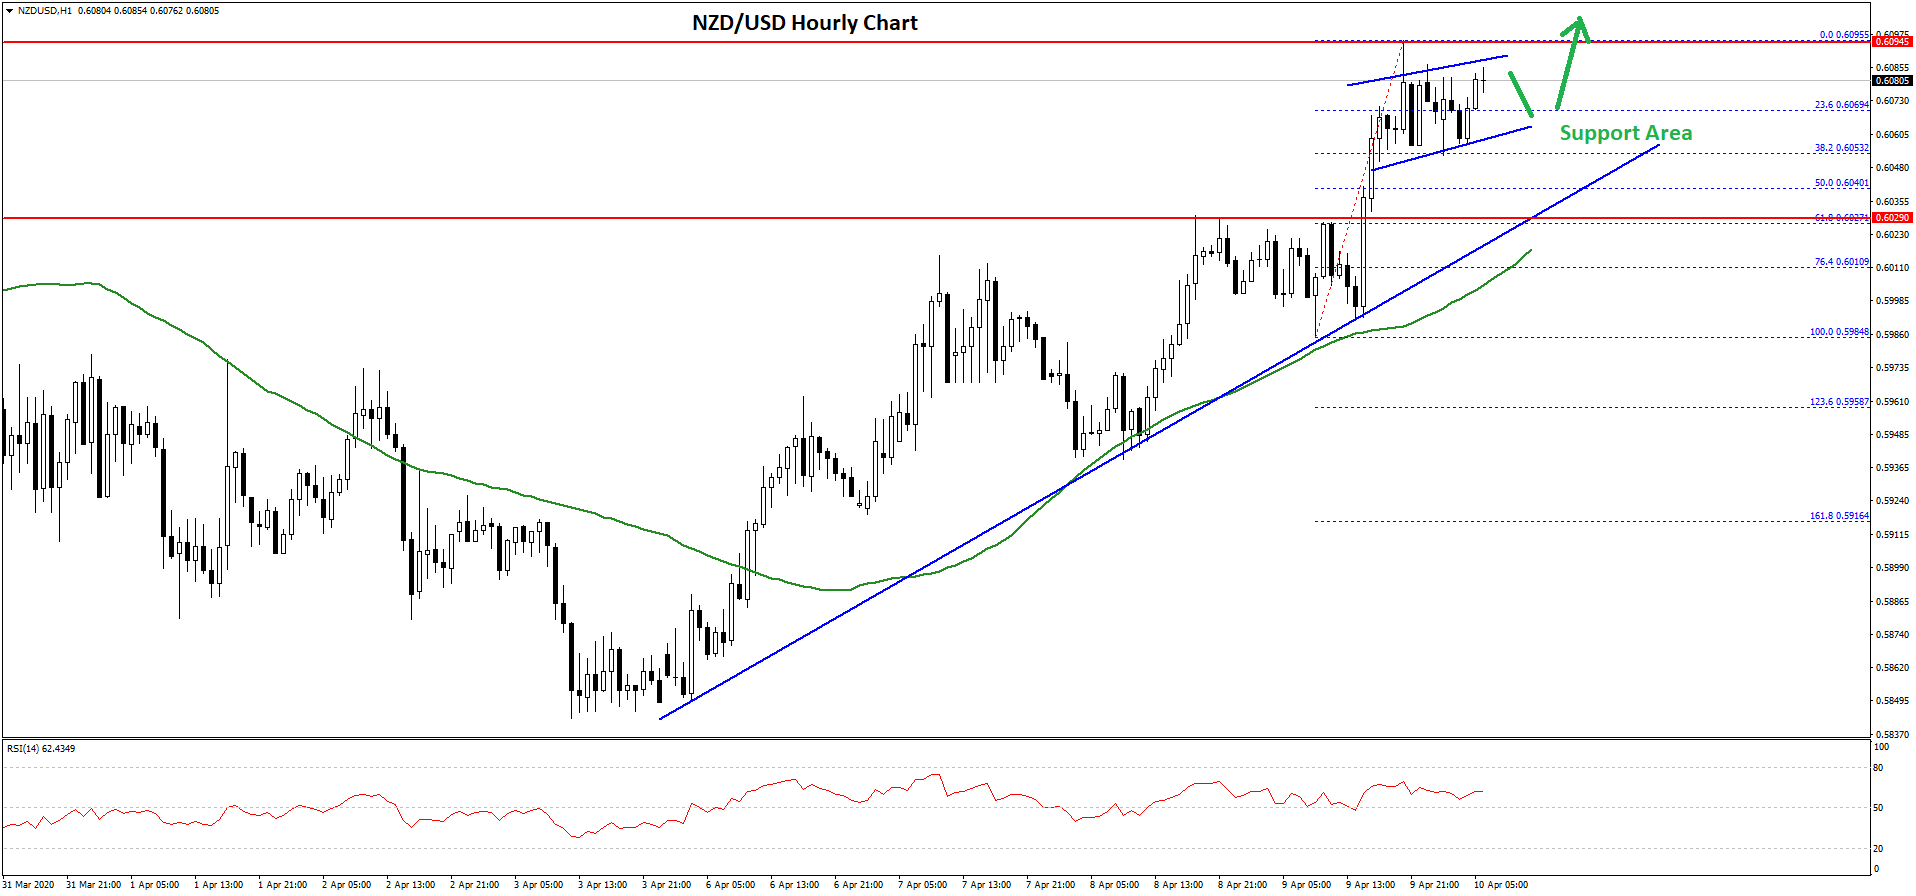
The pair declined below the 0.6070 level and tested the 38.2% Fib retracement level of the recent wave from the 0.5984 low to 0.6095 high.
On the downside, there is a strong support forming near the 0.6050 and 0.6040 levels. There is also a key bullish trend line forming with support near 0.6050 on the hourly chart of NZD/USD.
The 50% Fib retracement level of the recent wave from the 0.5984 low to 0.6095 high is also near the 0.6040 level to act as a strong support. Any further losses may perhaps call for a test of the 0.6020 support and the 50 hourly SMA.
Conversely, the NZD/USD pair might continue to rise above the 0.6080 level. An immediate resistance is near the 0.6100 level, above which the pair is likely to climb towards the 0.6150 and 0.6180 levels in the coming sessions.
Trade over 50 forex markets 24 hours a day with FXOpen. Take advantage of low commissions, deep liquidity, and spreads from 0.0 pips. Open your FXOpen account now or learn more about trading forex with FXOpen.
This article represents the opinion of the Companies operating under the FXOpen brand only. It is not to be construed as an offer, solicitation, or recommendation with respect to products and services provided by the Companies operating under the FXOpen brand, nor is it to be considered financial advice.
Stay ahead of the market!
Subscribe now to our mailing list and receive the latest market news and insights delivered directly to your inbox.

Latest from Forex Analysis
Latest articles

Weekly Market Wrap With Gary Thomson: Nasdaq, EUR/USD, USD/CHF, Brent Crude Oil, Googl Shares
Get the latest scoop on the week's hottest headlines, all in one convenient video. Join Gary Thomson, the COO of FXOpen UK, as he breaks down the most significant news reports and shares his expert insights.
- Nasdaq Composite: Worst Session

Analysis of AUD/USD: Exchange Rate Falls to Early May Low
As indicated by the 4-hour AUD/USD chart today:
→ the rate fell below 0.652, a level last seen on May 2;
→ the RSI indicator dropped below 15, a level last seen during the panic over the spread of COVID-19

Analysis of AMZN Stock: Price at 1.5-Month Low
As shown in the AMZN chart, the stock price dropped below:
→ the psychological level of $180;
→ the mid-June interim low.
The last time AMZN traded below $180 was in early June.
Thus, AMZN has faced sell-offs, similar to other tech