


AUD/USD and NZD/USD Monthly Outlook
FXOpen
AUD/USD found a strong support near 0.7040 and recovered. Similarly, NZD/USD climbed higher recently and broke the 0.6600 resistance area to move into a bullish zone.
Important Takeaways for AUD/USD and NZD/USD
- The Aussie Dollar found a strong buying interest near the 0.7040-0.7060 area against the US Dollar.
- There was a break above a major bearish trend line with resistance at 0.7180 on the daily chart of AUD/USD.
- NZD/USD also formed a crucial bottom near the 0.6420 level and recovered higher.
- There was a break above a key bearish trend line with resistance at 0.6550 on the daily chart.
AUD/USD Technical Analysis
After a major decline in the past few weeks, the Aussie Dollar finally found a strong support near the 0.7040 level against the US Dollar. The AUD/USD pair started a major upward move and climbed above the 0.7100 and 0.7200 resistance levels.
During the rise, the pair also broke the 50% Fibonacci retracement level of the last slide from the 0.7451 high to 0.7020 swing low. Besides, there was a close above the 0.7200 barrier and the 50-day simple moving average.
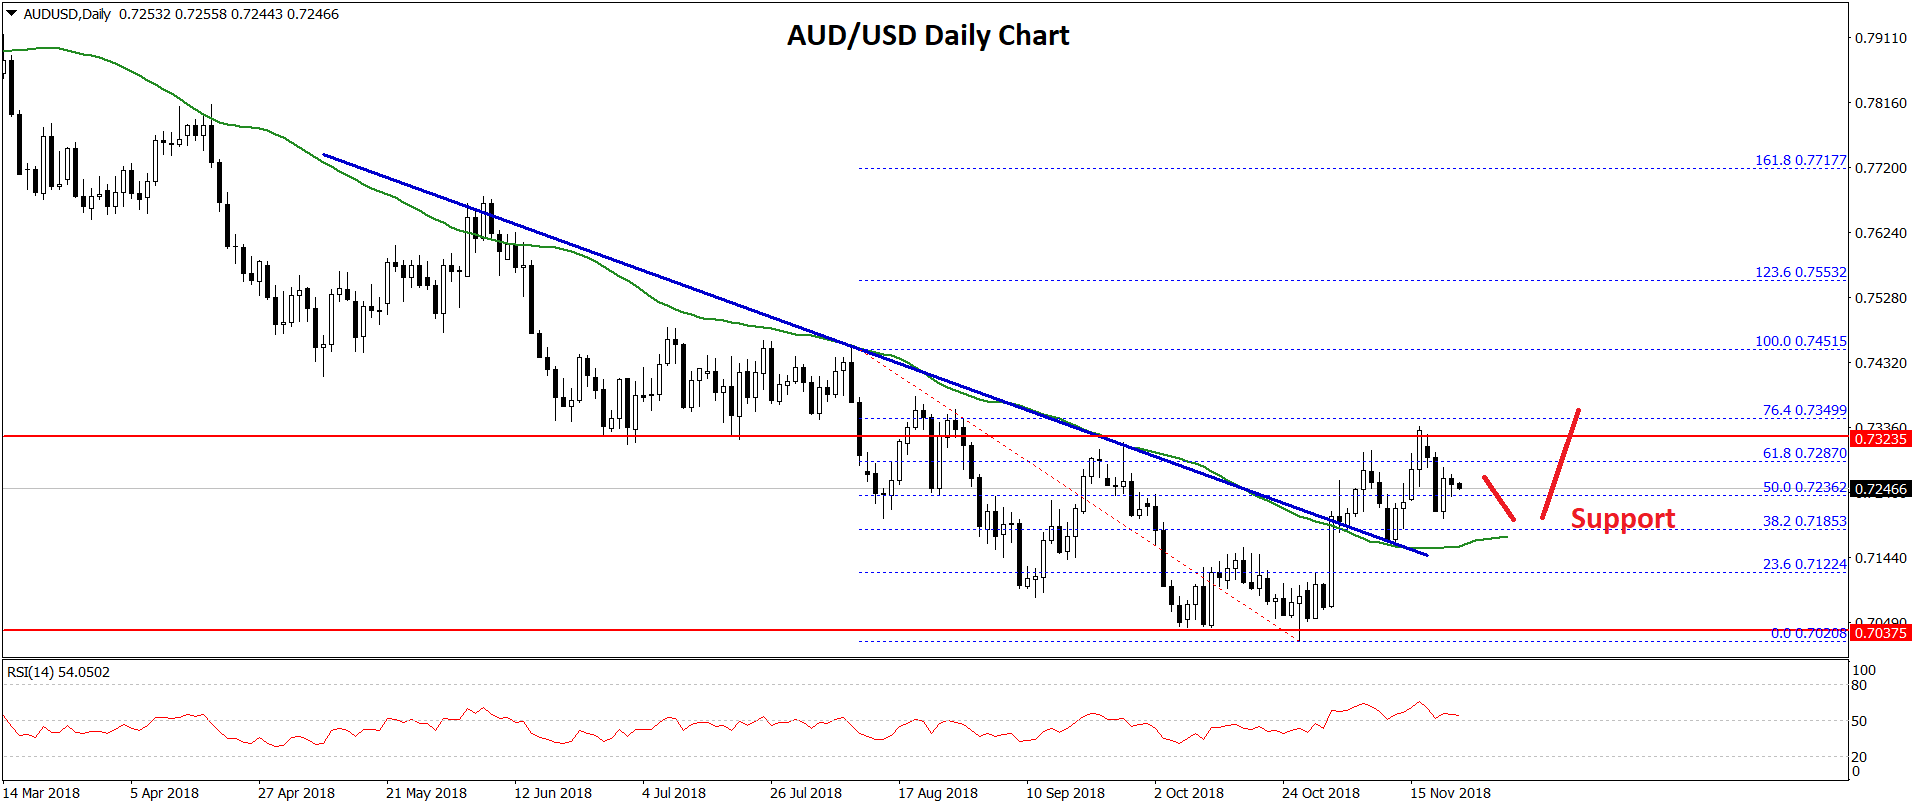
More importantly, there was a break above a major bearish trend line with resistance at 0.7180 on the daily chart. The pair even broke the 0.7300 resistance and traded towards the 0.7330 level.
The pair failed to break the 76.4% Fibonacci retracement level of the last slide from the 0.7451 high to 0.7020 swing low and later corrected lower.
However, the recent break above the 0.7250 level and the trend line suggests that the pair moved into a positive zone. Therefore, there are chances of more gains in the near term towards the 0.7400 level. If buyers remain in action, the pair could even test the 0.7530 level, which is near the 1.236 Fib extension level of the last slide from the 0.7451 high to 0.7020 swing low.
On the downside, the key supports are 0.7200 and 0.7180, below which the pair may decline back towards the 0.7100 level.
NZD/USD Technical Analysis
The New Zealand Dollar also gained traction recently after it formed a decent support at 0.6430 against the US Dollar. The NZD/USD pair traded higher and broke the 0.6500 and 0.6600 resistance levels to enter a positive zone.
During the rise, the pair cleared many hurdles near the 0.6600 level and the 0.6650 pivot zone. Moreover, there was a break above a key bearish trend line with resistance at 0.6550 on the daily chart.
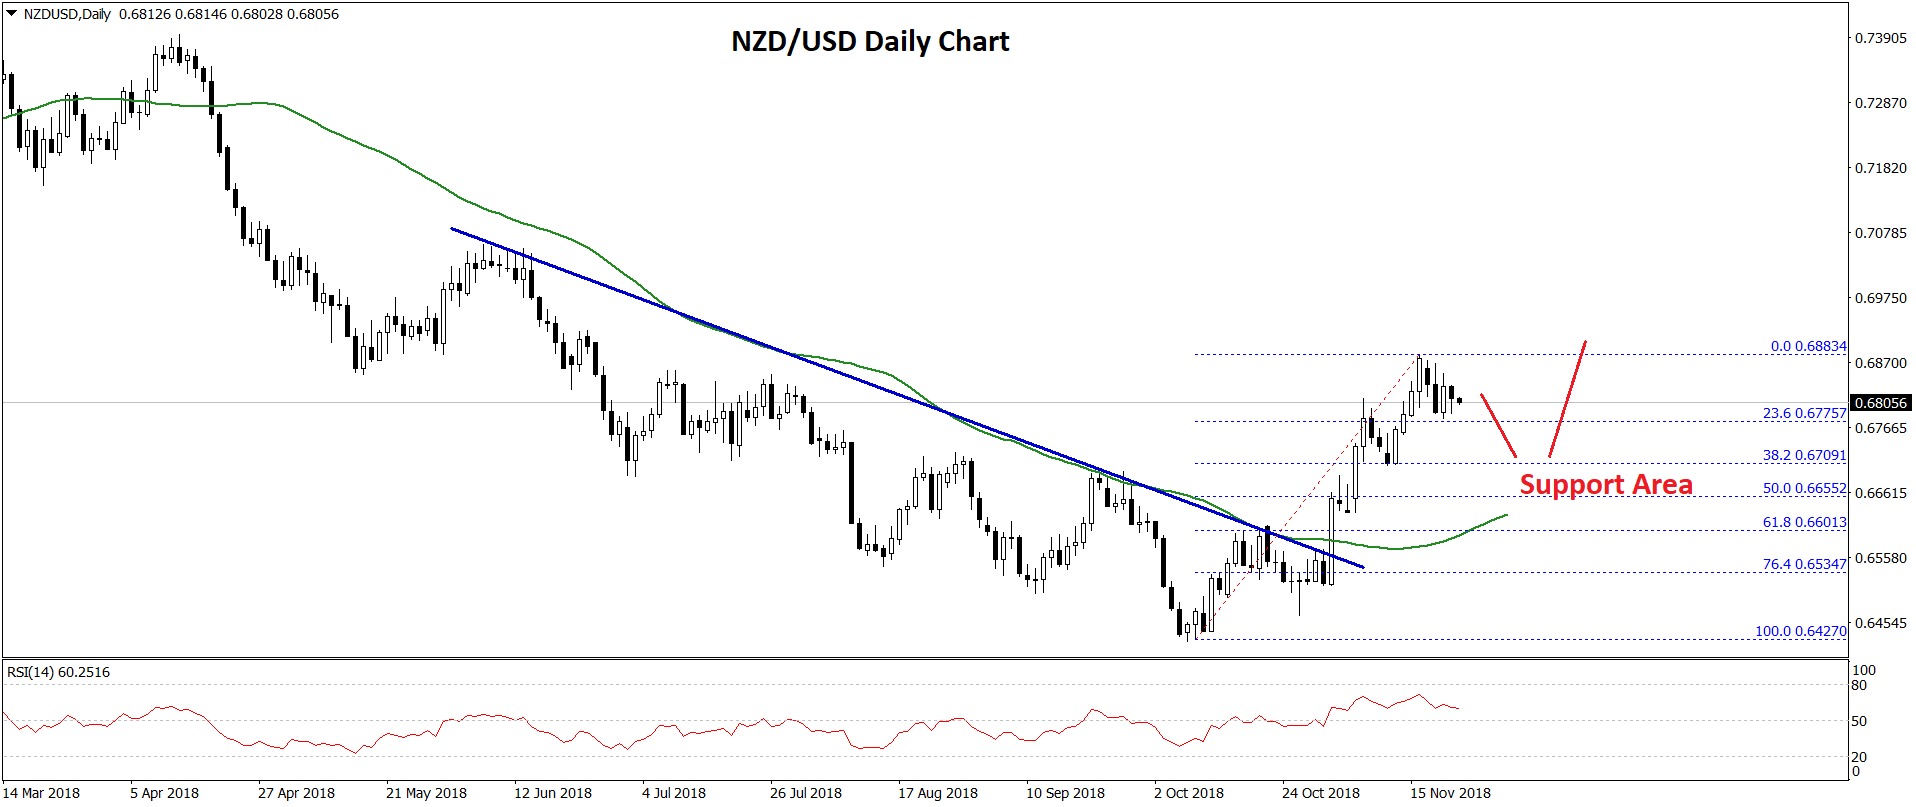
The pair settled above the 0.6700 resistance and the 50-day simple moving average. A new monthly high was formed at 0.6883 on FXOpen and the pair is currently consolidating gains.
An initial support is near the 0.6700 level and the 38.2% Fib retracement level of the recent upside move from the 0.6427 low to 0.6883 high. Below the 0.6700 support, the pair could test the key 0.6650 support.
The 0.6650 support also coincides with the 50% Fib retracement level of the recent upside move from the 0.6427 low to 0.6883 high. Therefore, dips from the current levels in the medium term remains supported near 0.6700 and 0.6650 levels.
On the upside, a break above the recent high at 0.6883 could spark more gains in NZD/USD above the 0.6850 level. The next major for buyers is at 0.7000, above which the pair could rise to 0.7200.
Trade over 50 forex markets 24 hours a day with FXOpen. Take advantage of low commissions, deep liquidity, and spreads from 0.0 pips (additional fees may apply). Open your FXOpen account now or learn more about trading forex with FXOpen.
This article represents the opinion of the Companies operating under the FXOpen brand only. It is not to be construed as an offer, solicitation, or recommendation with respect to products and services provided by the Companies operating under the FXOpen brand, nor is it to be considered financial advice.
Stay ahead of the market!
Subscribe now to our mailing list and receive the latest market news and insights delivered directly to your inbox.


Latest articles

EUR/USD Eyes Gains As USD/CHF Weakness Deepens Again
EUR/USD started a fresh increase above 1.1700 and 1.1720. USD/CHF declined further and is now struggling below 0.7835.
Important Takeaways for EUR/USD and USD/CHF Analysis Today
· The Euro started a decent increase from

Apple: Earnings Day Above the Activity Zone
On 30 April, after the market close, Apple Inc. will release its financial results for the second quarter of fiscal 2026. The consensus forecast, based on estimates from 31 analysts, points to revenue of around $109.7 billion, with expected

USD/JPY and USD/CHF Near Key Levels: The Dollar Supported by the Fed
The US dollar continues to trend upwards following the Federal Reserve meeting, drawing support from the regulator’s moderately hawkish stance and comments by Jerome Powell. Markets interpret the Fed’s rhetoric as a signal that restrictive policy is likely