


FXOpen

AUD/USD failed to clear the 0.7800 resistance and corrected lower. NZD/USD is likely to decline further if there is a break below the 0.7180 level.
Important Takeaways for AUD/USD and NZD/USD
- The Aussie Dollar is struggling to gain pace above 0.7800 zone against the US Dollar.
- There is a major bearish trend line forming with resistance near 0.7775 on the hourly chart of AUD/USD.
- NZD/USD corrected lower after it failed to surpass the 0.7270 resistance zone.
- There is a key contracting triangle forming with support near 0.7180 on the hourly chart of NZD/USD.
AUD/USD Technical Analysis
Recently, the Aussie Dollar attempted an upside break above the 0.7800 resistance against the US Dollar. The AUD/USD pair failed to settle above 0.7800 and started a fresh decline.
It broke the 0.7750 support level and tested the 0.7710 level. A low was formed near 0.7710 on FXOpen and it recently there was an upside correction. The pair climbed above 0.7750 and the 50 hourly simple moving average.
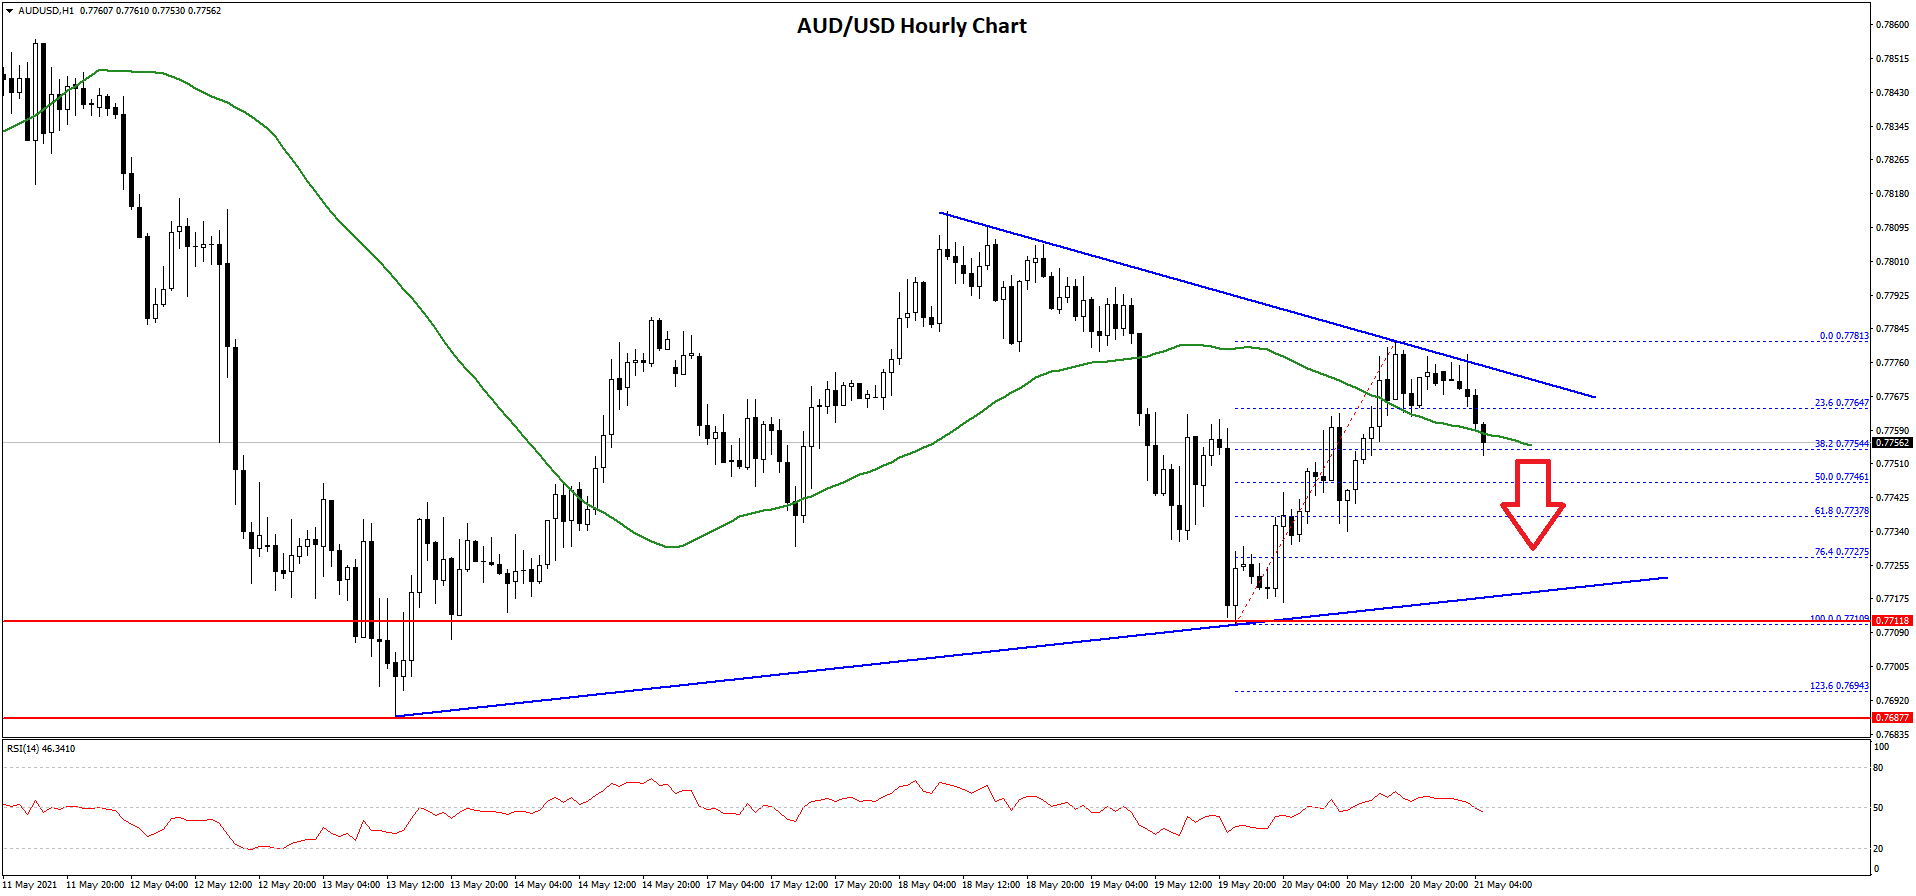
However, it is struggling to clear the 0.7780 level. A high is formed near 0.7781 and the pair is now correcting lower. There was a break below the 23.6% Fib retracement level of the upward move from the 0.7710 swing low to 0.7781 high.
The pair is now trading near the 0.7755 level and the 50 hourly simple moving average. There is also a major bearish trend line forming with resistance near 0.7775 on the hourly chart of AUD/USD.
On the upside, there is a major resistance forming near the 0.7780 and 0.7800 levels. A successful break above the trend line and the 0.7800 zone is must for a steady increase. The next major resistance could be 0.7840, above which the price could rise towards the 0.7880 resistance.
Conversely, the pair could decline below the 0.7750 support zone. The next major support is near the 0.7725 level. If there is a downside break below the 0.7725 level, the pair could extend its decline towards the 0.7680 level.
NZD/USD Technical Analysis
The New Zealand Dollar also followed a similar path and declined after it failed to clear the 0.7270 resistance against the US Dollar. The NZD/USD pair broke the 0.7250 support zone to move into a short-term bearish zone.
There was a break below the 0.7220 support zone and the 50 hourly simple moving average. The pair even broke 0.7200 and tested the 0.7150 support zone.
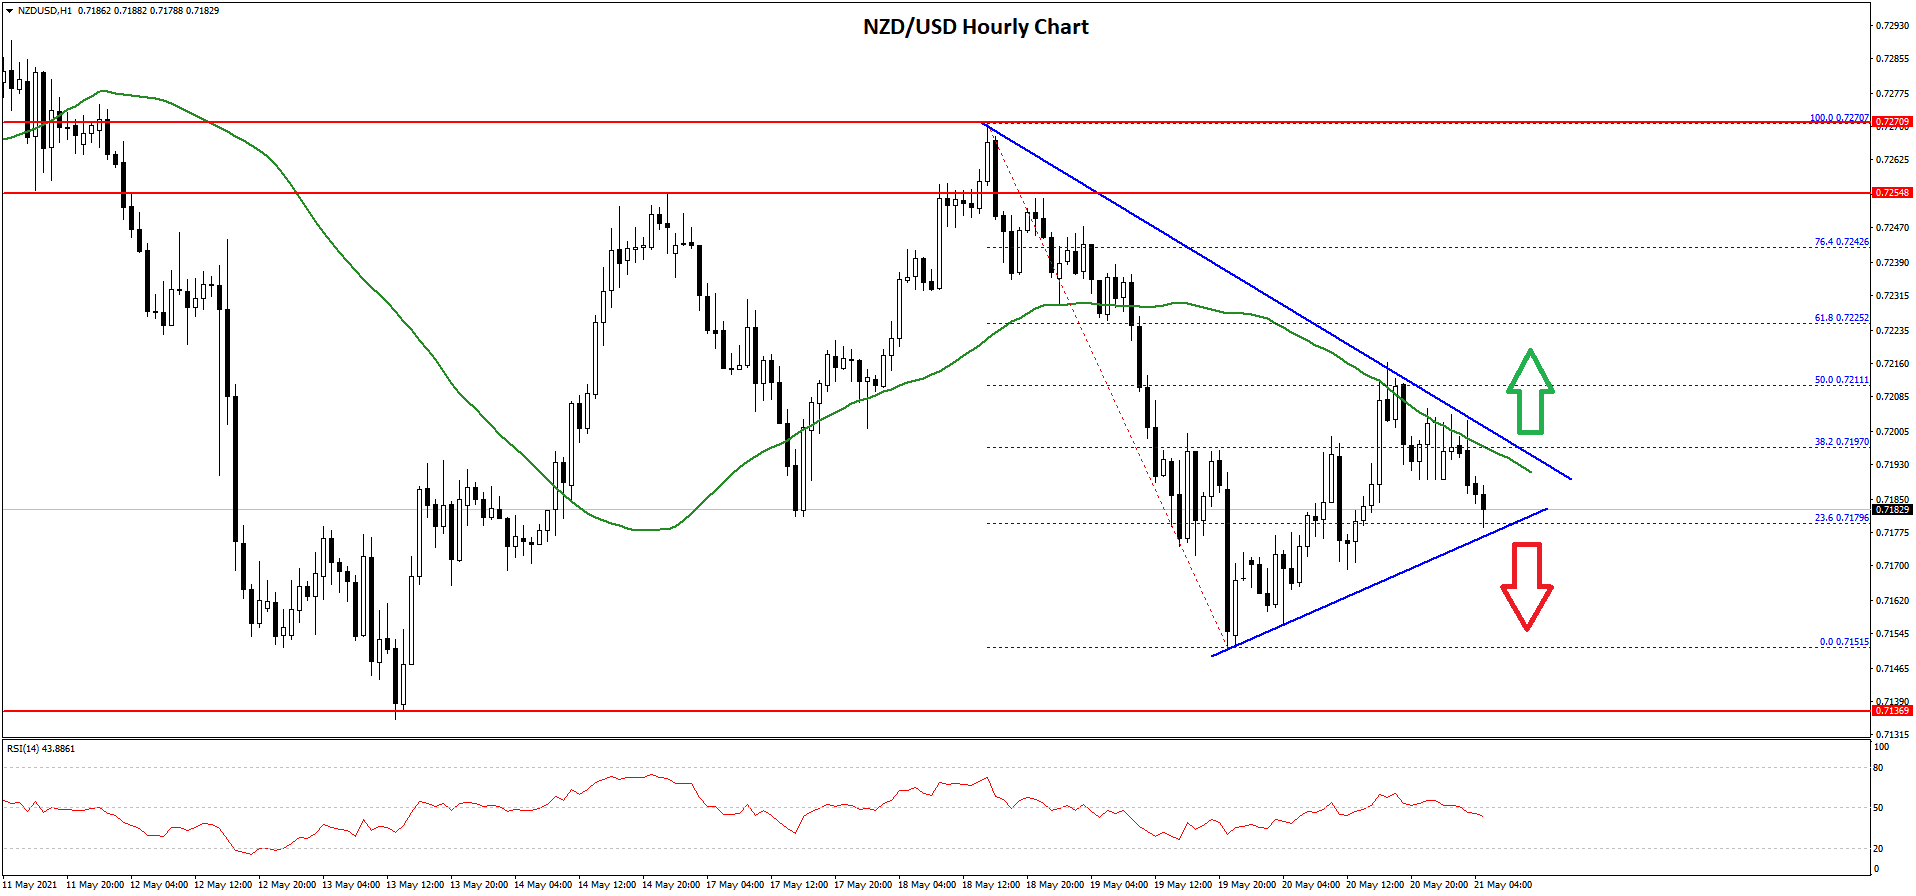
A low is formed near 0.7151 and the pair is now correcting higher. There was a break above the 23.6% Fib retracement level of the recent decline from the 0.7270 high to 0.7151 low. The pair is now facing a strong resistance near the 0.7200 zone and the 50 hourly simple moving average.
There is also a key contracting triangle forming with support near 0.7180 on the hourly chart of NZD/USD. It is near the 50% Fib retracement level of the recent decline from the 0.7270 high to 0.7151 low.
A clear upside break above the trend line resistance and the 50 hourly SMA could open the doors for a fresh move towards the 0.7250 level. The next major resistance is near the 0.7270 level.
Conversely, the pair could continue to move down below the 0.7180 support. If NZD/USD breaks the 0.7151 low, it is likely to decline towards the 0.7100 level.
This forecast represents FXOpen Markets Limited opinion only, it should not be construed as an offer, invitation or recommendation in respect to FXOpen Markets Limited products and services or as financial advice.
Trade over 50 forex markets 24 hours a day with FXOpen. Take advantage of low commissions, deep liquidity, and spreads from 0.0 pips. Open your FXOpen account now or learn more about trading forex with FXOpen.
This article represents the opinion of the Companies operating under the FXOpen brand only. It is not to be construed as an offer, solicitation, or recommendation with respect to products and services provided by the Companies operating under the FXOpen brand, nor is it to be considered financial advice.
Stay ahead of the market!
Subscribe now to our mailing list and receive the latest market news and insights delivered directly to your inbox.

Latest from Forex Analysis
Latest articles

Weekly Market Wrap With Gary Thomson: Nasdaq, EUR/USD, USD/CHF, Brent Crude Oil, Googl Shares
Get the latest scoop on the week's hottest headlines, all in one convenient video. Join Gary Thomson, the COO of FXOpen UK, as he breaks down the most significant news reports and shares his expert insights.
- Nasdaq Composite: Worst Session

Analysis of AUD/USD: Exchange Rate Falls to Early May Low
As indicated by the 4-hour AUD/USD chart today:
→ the rate fell below 0.652, a level last seen on May 2;
→ the RSI indicator dropped below 15, a level last seen during the panic over the spread of COVID-19

Analysis of AMZN Stock: Price at 1.5-Month Low
As shown in the AMZN chart, the stock price dropped below:
→ the psychological level of $180;
→ the mid-June interim low.
The last time AMZN traded below $180 was in early June.
Thus, AMZN has faced sell-offs, similar to other tech