


AUD/USD and NZD/USD Remain In Solid Uptrend
FXOpen
AUD/USD traded higher recently and broke the 0.7180 and 0.7220 resistance levels. Similarly, NZD/USD gained bullish momentum and rallied above the 0.6880 resistance.
Important Takeaways for AUD/USD and NZD/USD
- The Aussie Dollar gained traction and moved above the 0.7200 resistance against the US Dollar.
- There is a major bullish trend line in place with support at 0.7220 on the hourly chart of AUD/USD.
- NZD/USD broke many hurdles and surged above the 0.6900 resistance level.
- There is a key connecting bullish trend line formed with support at 0.6875 on the hourly chart.
AUD/USD Technical Analysis
After trading towards the 0.7080 support, the Aussie Dollar found a strong buying interest against the US Dollar. The AUD/USD pair started a solid upward move and traded above the 0.7150 and 0.7200 resistance levels.
Buyers even pushed the pair above the 0.7250 resistance and the 50 hourly simple moving average. A high was formed at 0.7295 on FXOpen and later the pair started a downside correction. It traded below the 0.7260 support and the 38.2% Fib retracement level of the recent wave from the 0.7180 low to 0.7295 high.
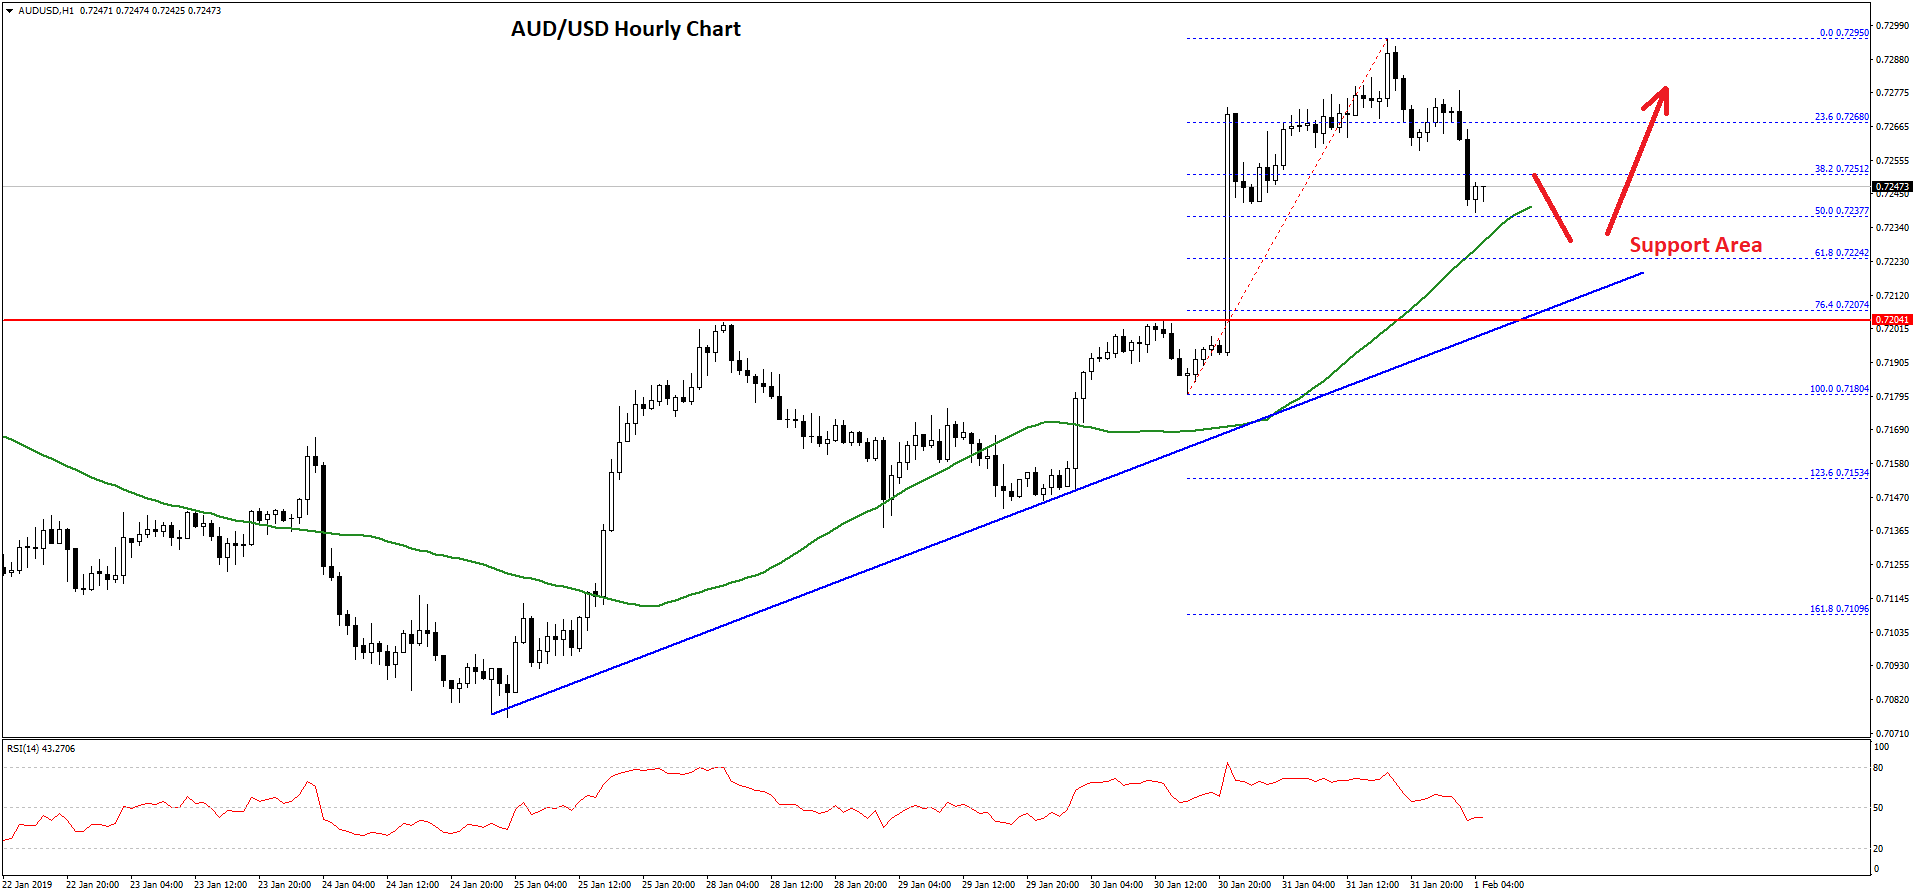
However, there are many supports on the downside near the 0.7220 level. An initial support is the 50% Fib retracement level of the recent wave from the 0.7180 low to 0.7295 high.
Moreover, the 50 hourly simple moving average is near the 0.7235 level. Finally, there is a major bullish trend line in place with support at 0.7220 on the hourly chart of AUD/USD. Therefore, if there is a downside correction, the pair is likely to find a strong buying interest near the 0.7230 and 0.7220 levels.
On the upside, an initial resistance is near the 0.7265 level, above which the pair could retest the 0.7295 swing high. Above 0.7295, the pair is likely to gain momentum above the 0.7300 and 0.7320 resistance levels in the near term.
NZD/USD Technical Analysis
The New Zealand Dollar also followed a similar structure and started a solid upward move from the 0.6750 support against the US Dollar. The NZD/USD pair broke the 0.6800 and 0.6850 resistance levels to move into a bullish zone.
During the rise, the pair also broke the 0.6880 resistance and the 50 hourly simple moving average. Finally, the pair climbed above the 0.6900 and 0.6920 levels before sellers appeared near the 0.6935 level.
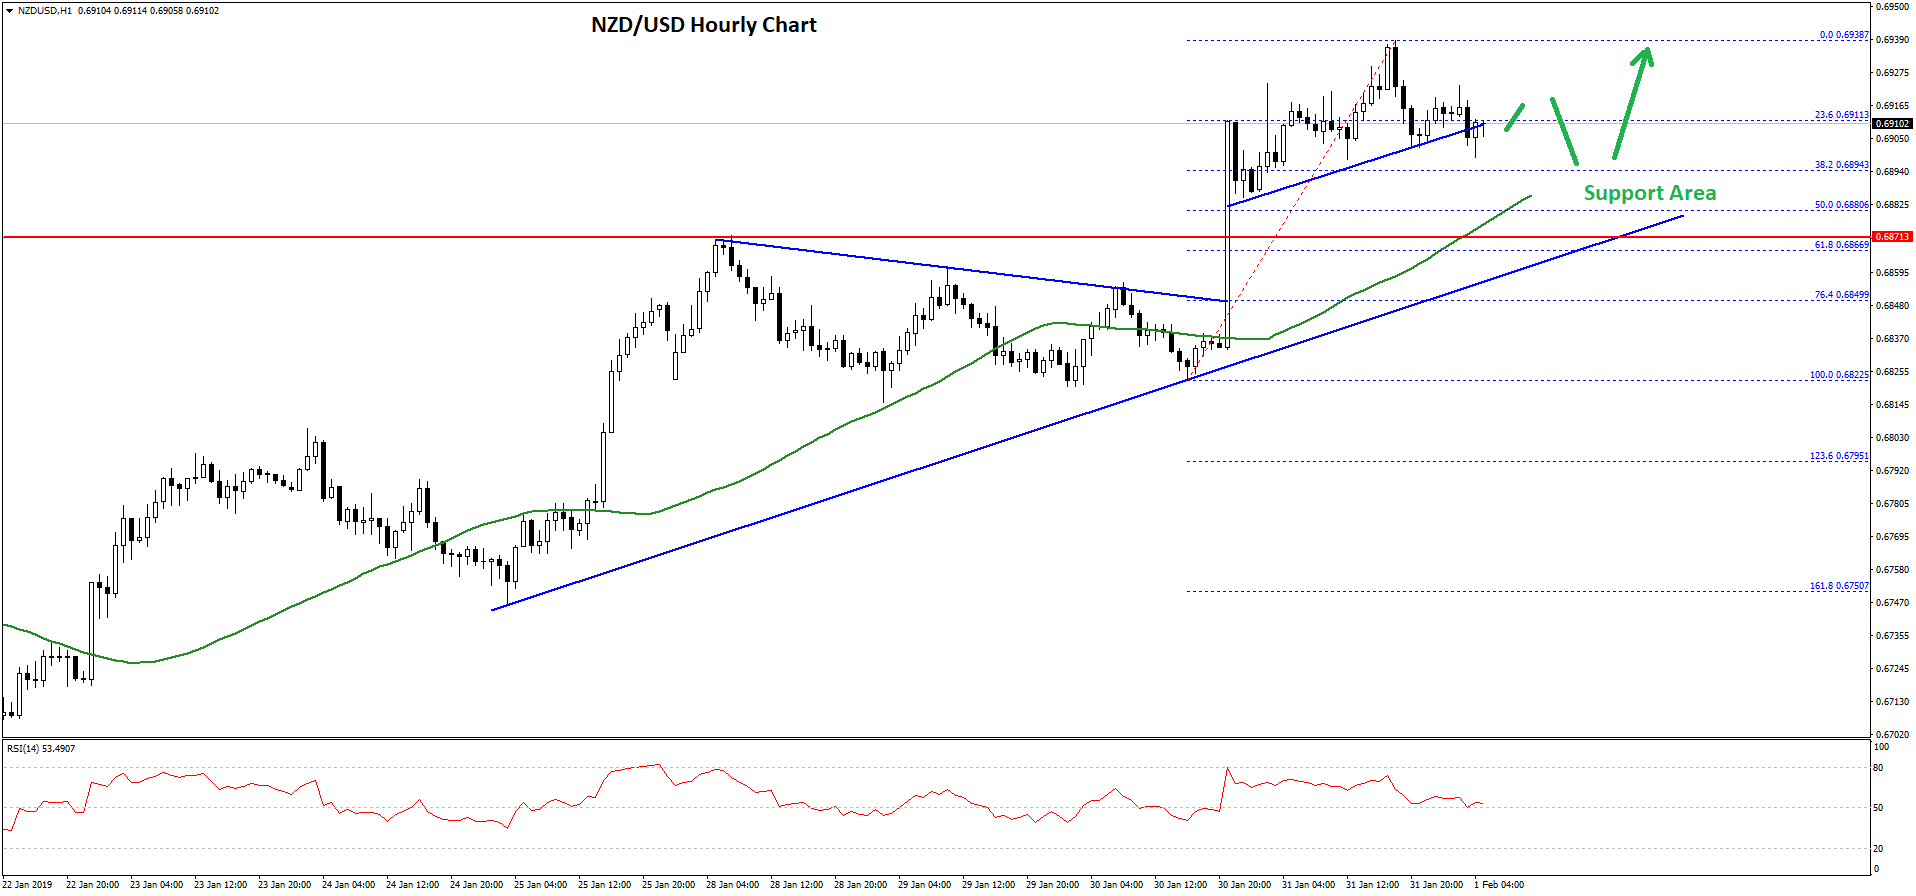
A high was formed at 0.6938 and later the pair corrected lower. It broke a connecting bullish trend line a 0.6915 on the hourly chart and the 23.6% Fib retracement level of the recent wave from the 0.6822 low to 0.6938 high.
However, there are many supports on the downside near the 0.6890 and 0.6880 levels. The 50% Fib retracement level of the recent wave from the 0.6822 low to 0.6938 high is near the 0.6880 to act as a solid support along with the 50 hourly simple moving average.
Finally, there is a key connecting bullish trend line formed with support at 0.6875 on the hourly chart. Therefore, if NZD/USD corrects lower in the short term, it is likely to find a strong buying interest near the 0.6890 and 0.6880 levels.
Trade over 50 forex markets 24 hours a day with FXOpen. Take advantage of low commissions, deep liquidity, and spreads from 0.0 pips (additional fees may apply). Open your FXOpen account now or learn more about trading forex with FXOpen.
This article represents the opinion of the Companies operating under the FXOpen brand only. It is not to be construed as an offer, solicitation, or recommendation with respect to products and services provided by the Companies operating under the FXOpen brand, nor is it to be considered financial advice.
Stay ahead of the market!
Subscribe now to our mailing list and receive the latest market news and insights delivered directly to your inbox.


Latest articles

Apple: Earnings Day Above the Activity Zone
On 30 April, after the market close, Apple Inc. will release its financial results for the second quarter of fiscal 2026. The consensus forecast, based on estimates from 31 analysts, points to revenue of around $109.7 billion, with expected

USD/JPY and USD/CHF Near Key Levels: The Dollar Supported by the Fed
The US dollar continues to trend upwards following the Federal Reserve meeting, drawing support from the regulator’s moderately hawkish stance and comments by Jerome Powell. Markets interpret the Fed’s rhetoric as a signal that restrictive policy is likely

EUR/USD and GBP/USD consolidate ahead of the Fed decision
European currencies are showing subdued dynamics, entering a consolidation phase following their previous advance. Earlier, EUR/USD and GBP/USD broke out of their ranges and strengthened; however, the subsequent correction has led both pairs to retest the previously breached