


AUD/USD and NZD/USD Remain Supported for More Gains
FXOpen
AUD/USD extended increase above the 0.7200 resistance. NZD/USD is also showing a lot of positive signs above the 0.6500 level.
Important Takeaways for AUD/USD and NZD/USD
· The Aussie Dollar started a fresh increase from the 0.7150 support zone against the US Dollar.
· There was a break above a short-term contracting triangle with resistance near 0.7162 on the hourly chart of AUD/USD.
· NZD/USD also started a decent increase after it cleared the 0.6500 resistance zone.
· There was a move above a major bearish trend line with resistance near 0.6520 on the hourly chart of NZD/USD.
AUD/USD Technical Analysis
The Aussie Dollar formed a base above the 0.7150 level and started a fresh increase against the US Dollar. The AUD/USD pair gained pace for a move above the 0.7185 resistance zone.
There was a break above a short-term contracting triangle with resistance near 0.7162 on the hourly chart of AUD/USD. The pair even settled above the 0.7240 level and the 50 hourly simple moving average.
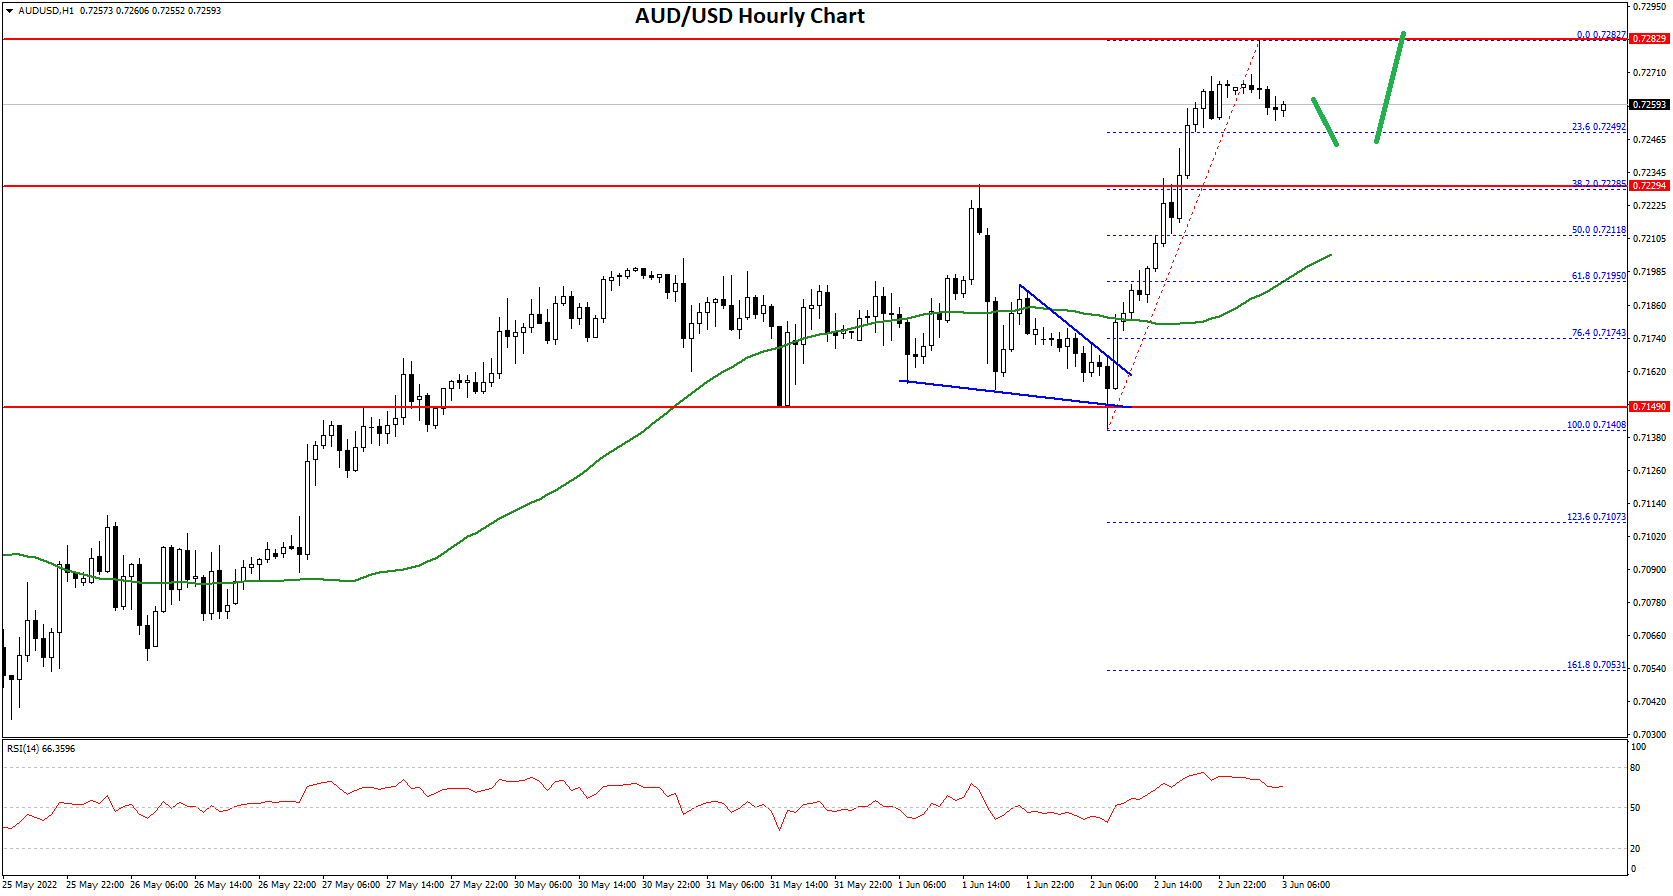
It traded as high as 0.7282 on FXOpen and is currently correcting gains. There was a move below the 0.7270 support zone.
However, the pair is still above the 23.6% Fib retracement level of the upward move from the 0.7140 swing low to 0.7282 high. On the downside, an initial support is near the 0.7250 level.
The next support could be the 0.7230 level. The main support is near the 0.7210 level and the 50 hourly simple moving average. It is close to the 50% Fib retracement level of the upward move from the 0.7140 swing low to 0.7282 high.
If there is a downside break below the 0.7210 support, the pair could extend its decline towards the 0.7150 level. Any more downsides might send the pair toward the 0.7080 level.
On the upside, the AUD/USD pair is facing resistance near the 0.7280 level. The next major resistance is near the 0.7320 level. A close above the 0.7320 level could start a steady increase in the near term. The next major resistance could be 0.7450.
NZD/USD Technical Analysis
The New Zealand Dollar also followed a similar path from the 0.6460 zone against the US Dollar. The NZD/USD pair gained pace above the 0.6500 resistance zone.
There was a clear move above the 0.6540 resistance zone and the 50 hourly simple moving average. Besides, there was a move above a major bearish trend line with resistance near 0.6520 on the hourly chart of NZD/USD.
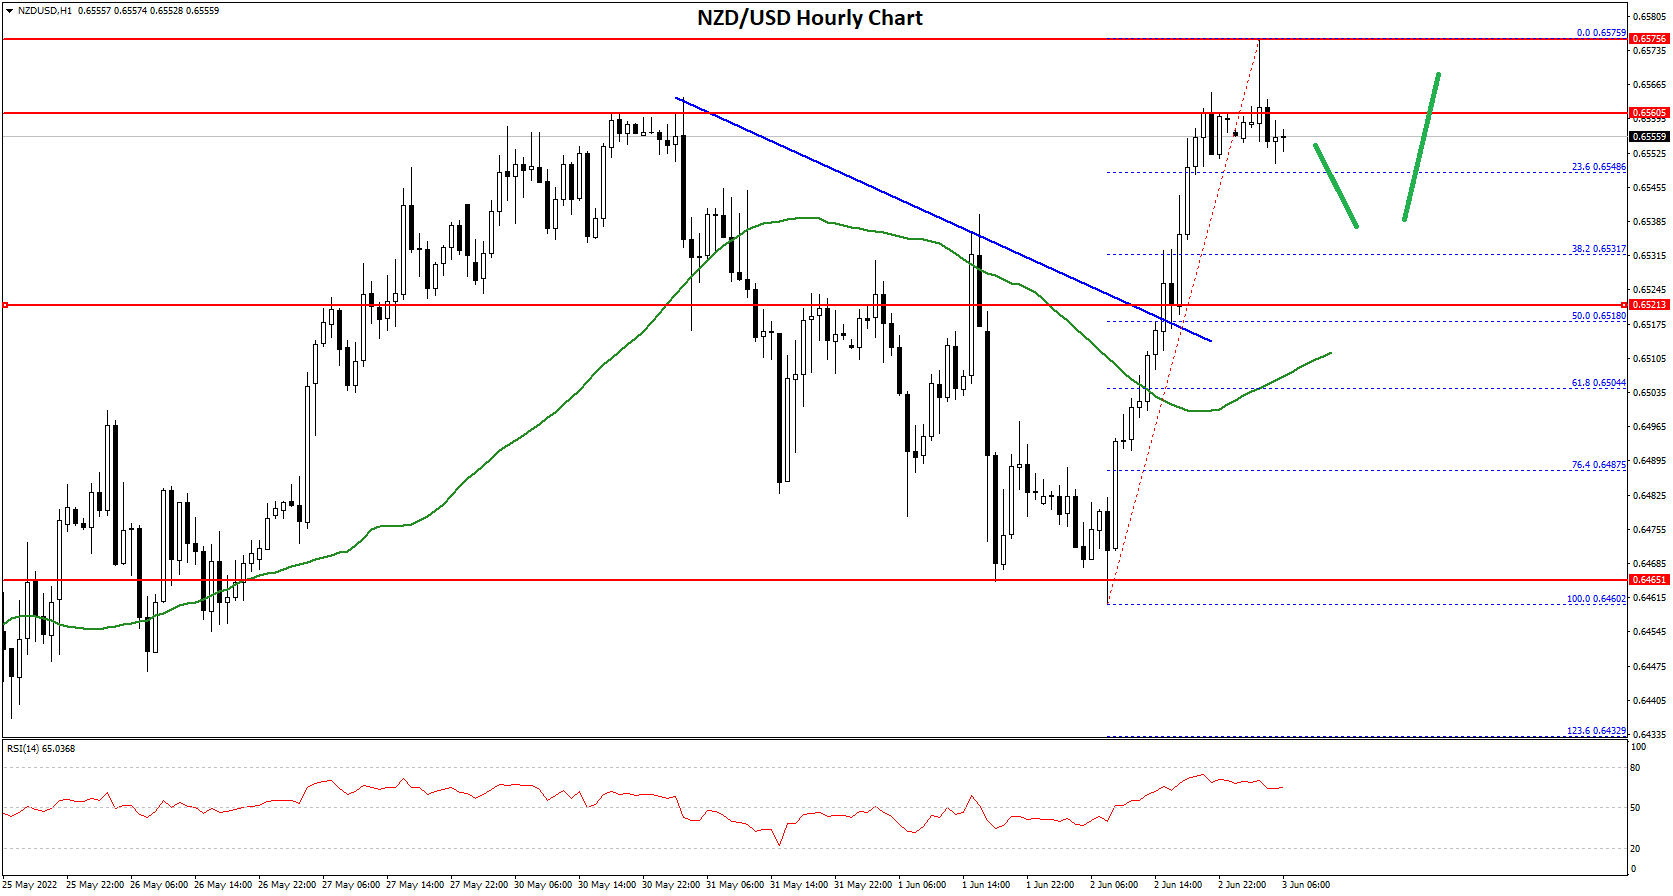
It even spiked above the 0.6570 level and traded as high as 0.6575. It is now correcting gains and trading close to the 23.6% Fib retracement level of the upward move from the 0.6460 swing low to 0.6575 high.
On the downside, an initial support is near the 0.6540 level. The next support could be the 0.6520 zone. It is near the 50% Fib retracement level of the upward move from the 0.6460 swing low to 0.6575 high. If there is a downside break below the 0.6520 support, the pair could extend its decline towards the 0.6160 level.
On the upside, an initial resistance is near the 0.6575 level. The next major resistance is near the 0.6600 level. A clear move above the 0.6600 level might even push the pair towards the 0.6650 level.
This forecast represents FXOpen Markets Limited opinion only, it should not be construed as an offer, invitation or recommendation in respect to FXOpen Markets Limited products and services or as financial advice.
Trade over 50 forex markets 24 hours a day with FXOpen. Take advantage of low commissions, deep liquidity, and spreads from 0.0 pips (additional fees may apply). Open your FXOpen account now or learn more about trading forex with FXOpen.
This article represents the opinion of the Companies operating under the FXOpen brand only. It is not to be construed as an offer, solicitation, or recommendation with respect to products and services provided by the Companies operating under the FXOpen brand, nor is it to be considered financial advice.
Stay ahead of the market!
Subscribe now to our mailing list and receive the latest market news and insights delivered directly to your inbox.


Latest articles

US Dollar Index: A Defining Week for the King of the Markets
The dollar heads into a pivotal week trading near 101.80, just off a 15-month high, with the Fed's July 29 meeting standing as the clear focal point. Markets currently price roughly a 65% chance of a hold, though renewed

NZD/USD: Inflation Surge Meets Strong US Dollar Pressure
On 21 July, Stats NZ reported an acceleration in inflation: the Consumer Price Index rose 1.5% in the second quarter, while the annual inflation rate climbed to 4.1%, its highest level in more than two years and slightly

Weekly Market Insights with Gary Thomson: The Week of Central Banks and Earnings
In this video, we’ll explore the key economic events and market trends, shaping the financial landscape. Get ready for insights into financial markets to help you navigate the week ahead. Let’s dive in!
In this episode of Market