


AUD/USD And NZD/USD Showing Bearish Signs
FXOpen

AUD/USD started a strong decline from well above the 0.7350 support zone. Similarly, NZD/USD is showing bearish signs and it could decline towards 0.6650.
Important Takeaways for AUD/USD and NZD/USD
- The Aussie Dollar started major downward move below 0.7350 against the US Dollar.
- There is a crucial declining channel in place with resistance near 0.7280 on the hourly chart of AUD/USD.
- NZD/USD broke the 0.6720 support level to move into a short-term bearish zone.
- There was a break below a key bullish trend line with support near 0.6755 on the hourly chart of NZD/USD.
AUD/USD Technical Analysis
The Aussie Dollar started a major decline from the 0.7415 swing high against the US Dollar. The AUD/USD pair broke the 0.7350 support zone to move into a bearish zone.
The pair gained bearish momentum below the 0.7320 support level and the 50 hourly simple moving average. There was a break below the 50% Fib retracement level of the upward move from the 0.7150 swing low to 0.7415 high (formed on FXOpen).
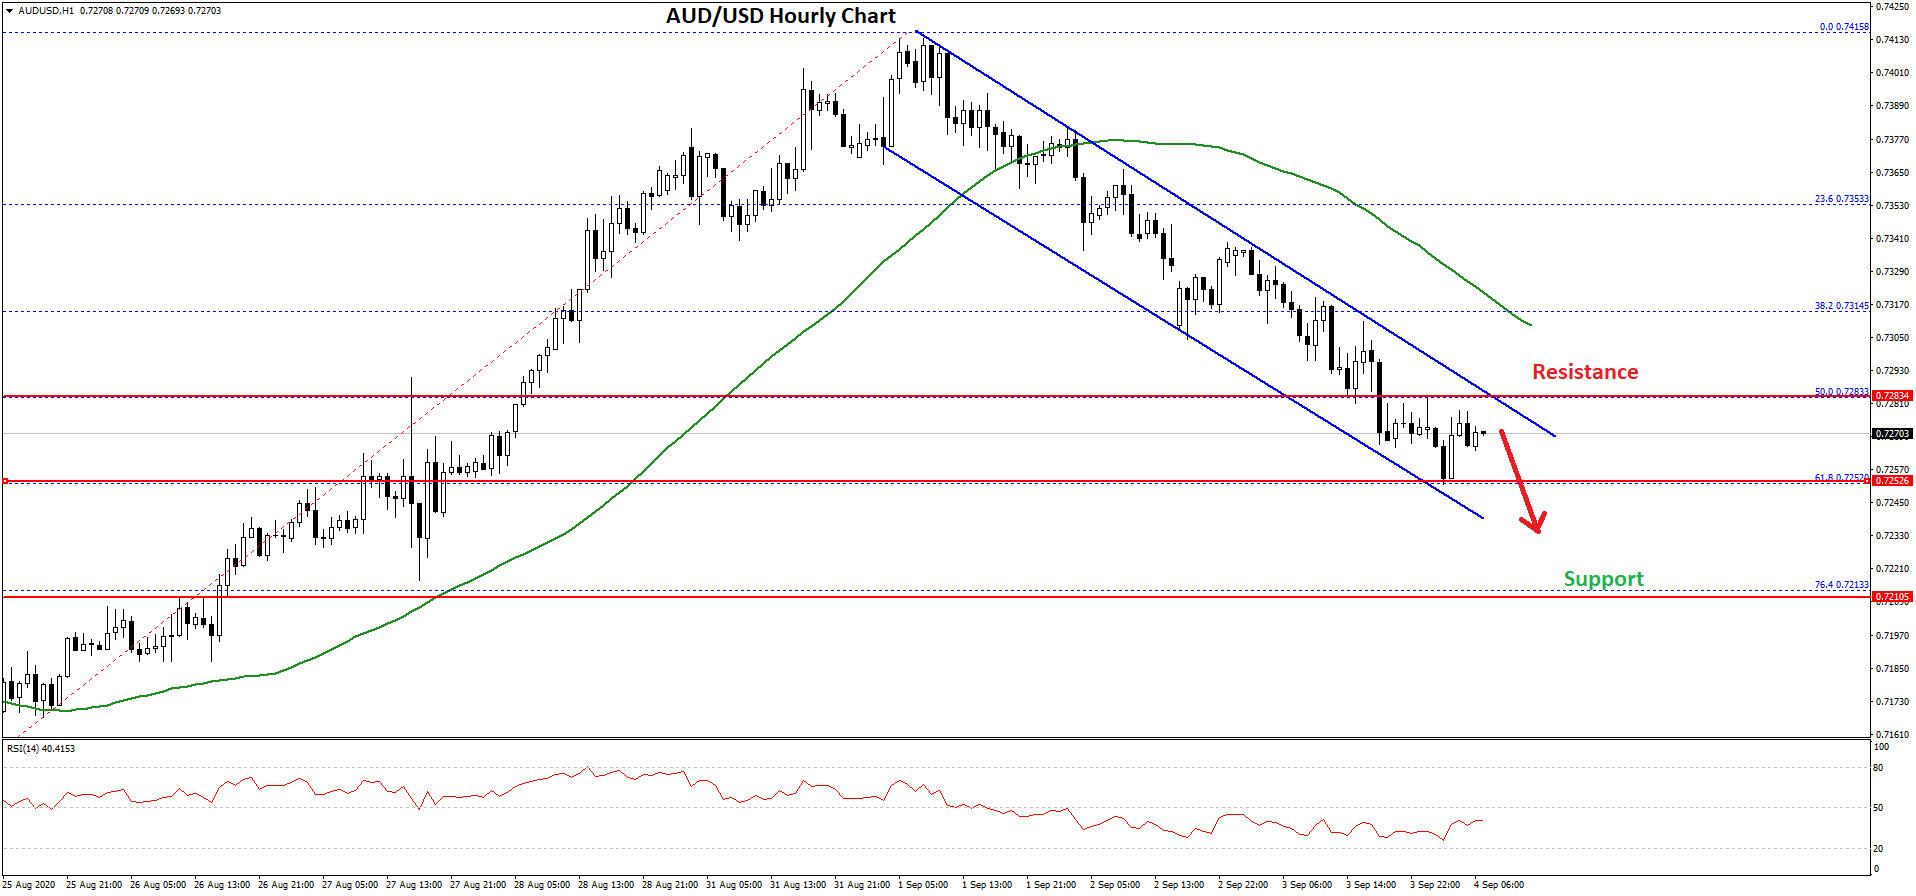
The pair is now trading below the 0.7280 support and testing the 61.8% Fib retracement level of the upward move from the 0.7150 swing low to 0.7415 high.
It seems like there is a crucial declining channel in place with resistance near 0.7280 on the hourly chart of AUD/USD. The first key support is near the 0.7250 level. If there is a downside break below the 0.7250 support, the pair could continue to move down towards the 0.7210 support.
Any further losses may lead the pair towards the 0.7200 support level. Conversely, the pair could break the 0.7280 resistance and the channel trend line to start a fresh increase above 0.7300.
The next resistance could be 0.7320, above which AUD/USD might test 0.7350. A clear break above 0.7350 could lead the pair towards the 0.7400 level in the near term.
NZD/USD Technical Analysis
The New Zealand Dollar was relatively stable above the 0.6650 support zone against the US Dollar. Earlier, the NZD/USD pair traded higher and tested the 0.6785 resistance zone.
A high was formed near 0.6788 before the pair started a downside correction. It traded below the 0.6750 support and the 50 hourly simple moving average to move into a short-term bearish zone.
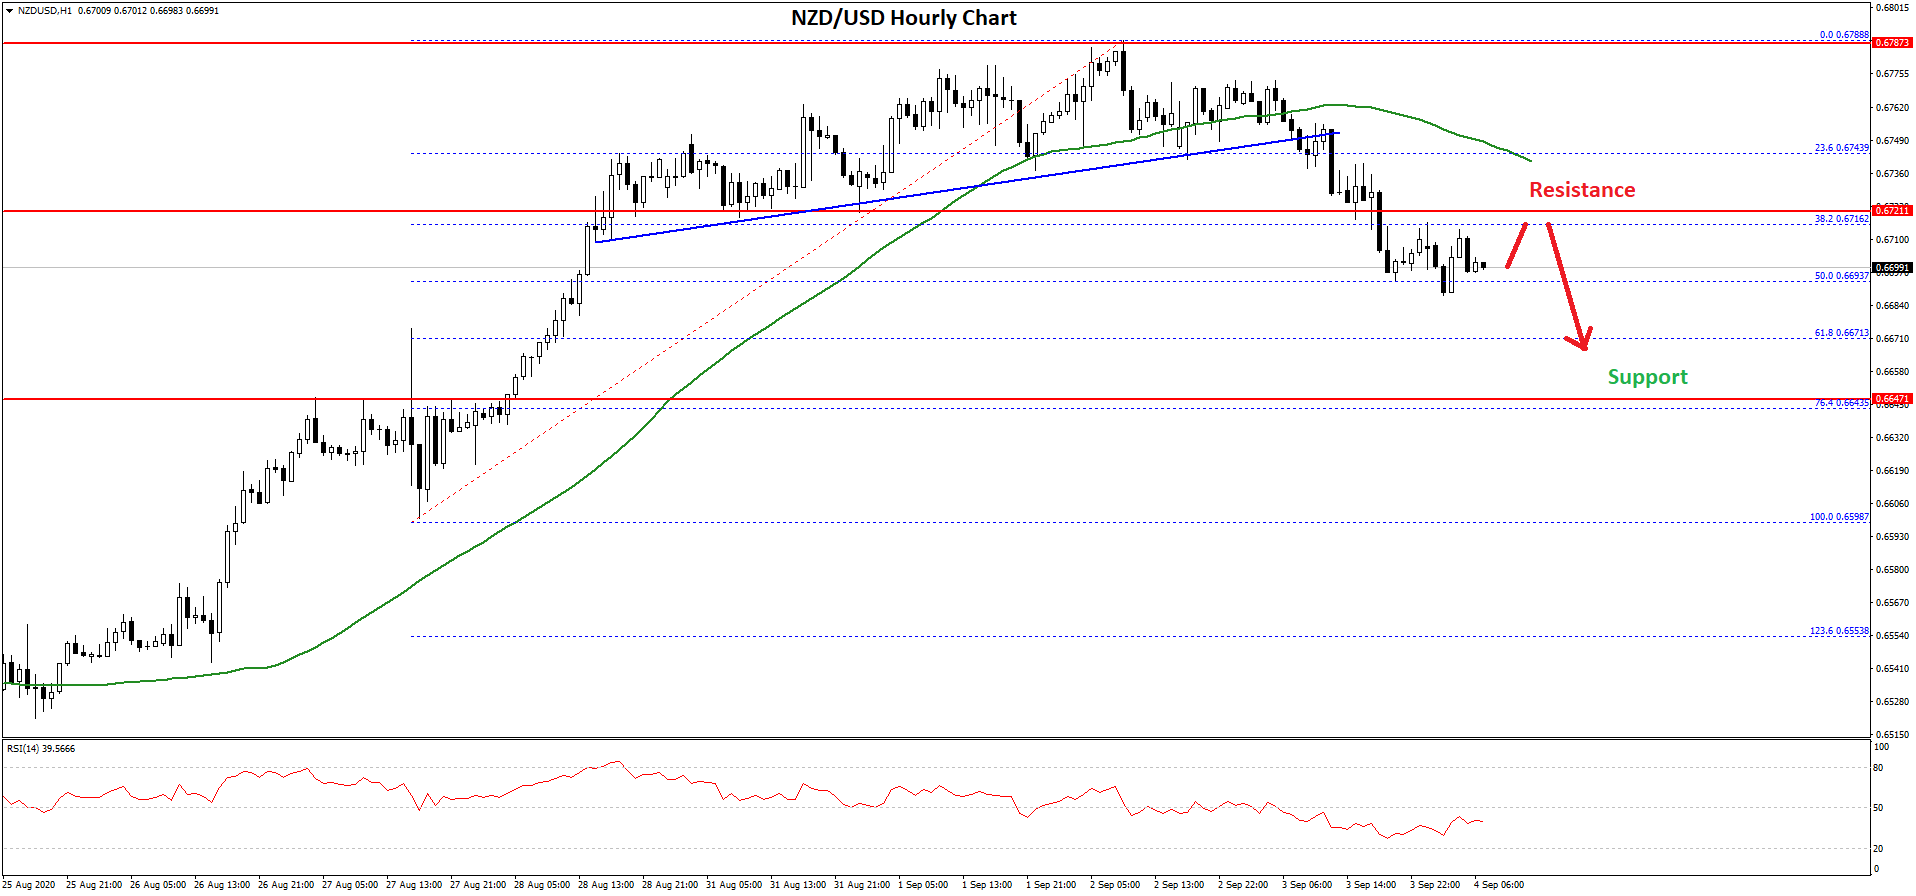
There was also a break below a key bullish trend line with support near 0.6755 on the hourly chart of NZD/USD. The pair tested the 50% Fib retracement level of the upward move from the 0.6598 swing low to 0.6788 high.
It seems like the pair might continue to move down below 0.6690. The next key support is near the 0.6640 level. It is close to the 76.4% Fib retracement level of the upward move from the 0.6598 swing low to 0.6788 high.
Any further losses may perhaps lead the pair towards the 0.6600 support level in the near term. On the upside, the previous support near 0.6720 is likely to act as a strong resistance.
The main resistance is near the 50 hourly SMA at 0.6740, above which NZD/USD might start a steady increase. In the stated case, the pair is likely to break the 0.6788 high and it could even surpass the 0.6800 resistance in the coming days.
Trade over 50 forex markets 24 hours a day with FXOpen. Take advantage of low commissions, deep liquidity, and spreads from 0.0 pips (additional fees may apply). Open your FXOpen account now or learn more about trading forex with FXOpen.
This article represents the opinion of the Companies operating under the FXOpen brand only. It is not to be construed as an offer, solicitation, or recommendation with respect to products and services provided by the Companies operating under the FXOpen brand, nor is it to be considered financial advice.
Stay ahead of the market!
Subscribe now to our mailing list and receive the latest market news and insights delivered directly to your inbox.


Latest articles

Apple: Earnings Day Above the Activity Zone
On 30 April, after the market close, Apple Inc. will release its financial results for the second quarter of fiscal 2026. The consensus forecast, based on estimates from 31 analysts, points to revenue of around $109.7 billion, with expected

USD/JPY and USD/CHF Near Key Levels: The Dollar Supported by the Fed
The US dollar continues to trend upwards following the Federal Reserve meeting, drawing support from the regulator’s moderately hawkish stance and comments by Jerome Powell. Markets interpret the Fed’s rhetoric as a signal that restrictive policy is likely

EUR/USD and GBP/USD consolidate ahead of the Fed decision
European currencies are showing subdued dynamics, entering a consolidation phase following their previous advance. Earlier, EUR/USD and GBP/USD broke out of their ranges and strengthened; however, the subsequent correction has led both pairs to retest the previously breached