


FXOpen
AUD/USD declined sharply below 0.7380 to move into a bearish zone. Similarly, NZD/USD is under a lot of pressure below the 0.6750 resistance.
Important Takeaways for AUD/USD and NZD/USD
- The Aussie Dollar declined continuously and settled below 0.7380 against the US Dollar.
- There is a major bearish trend line formed with resistance near 0.7375 on the hourly chart of AUD/USD.
- NZD/USD is under heavy selling pressure as it settled below the 0.6750 support.
- July 2018 NFP release is scheduled today, which could spark more downsides in AUD/USD and NZD/USD.
AUD/USD Technical Analysis
The Aussie Dollar formed a top near the 0.7440 level and started a downside move against the US Dollar. The AUD/USD pair declined steadily and broke many supports such as 0.7400, 0.7380 and 0.7370.
The pair even broke the 0.7360 support and traded as low as 0.7355. Buyers appeared and later the pair started consolidating in a range above the 0.7355 low. It traded above the 23.6% Fib retracement level of the last drop from the 0.7411 high to 0.7355 low.
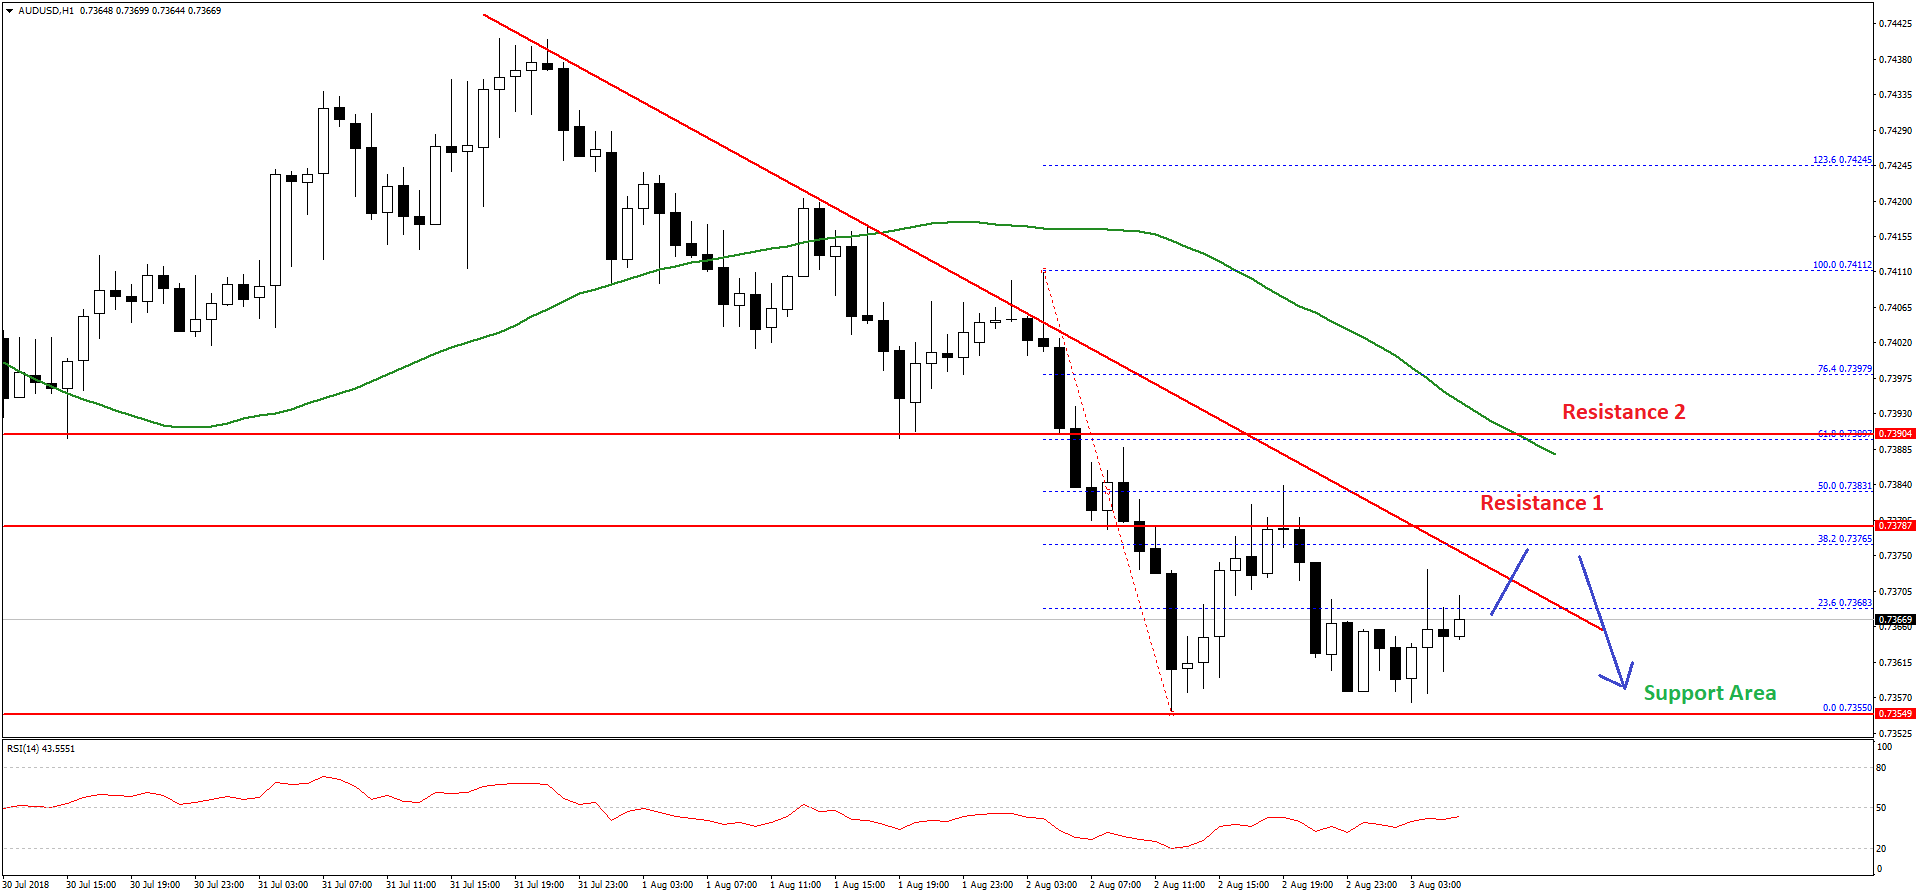
However, upsides were capped near the 0.7380 level, which was a support earlier. Moreover, the 50% Fib retracement level of the last drop from the 0.7411 high to 0.7355 low also acted as a barrier for buyers.
At the outset, there is a major bearish trend line formed with resistance near 0.7375 on the hourly chart. A break above the trend line and then 0.7380 is needed for more recoveries in the near term. The next resistance above 0.7380 is near 0.7390 and the 50 hourly simple moving average.
On the other hand, if the pair fails to recover above 0.7380, it could decline further. Should there be a break below the 0.7355 low, AUD/USD may perhaps accelerate losses towards the 0.7320 level in the near term.
NZD/USD Technical Analysis
The New Zealand Dollar declined heavily after it broke the 0.6785 support area against the US Dollar. The NZD/USD pair tumbled and broke the 0.6760 and 0.6750 support levels to move into a bearish zone.
The pair traded as low as 0.6724 and it is currently correcting higher. At the moment, the 23.6% Fib retracement level of the last decline from the 0.6763 high to 0.6724 low is acting as a resistance.
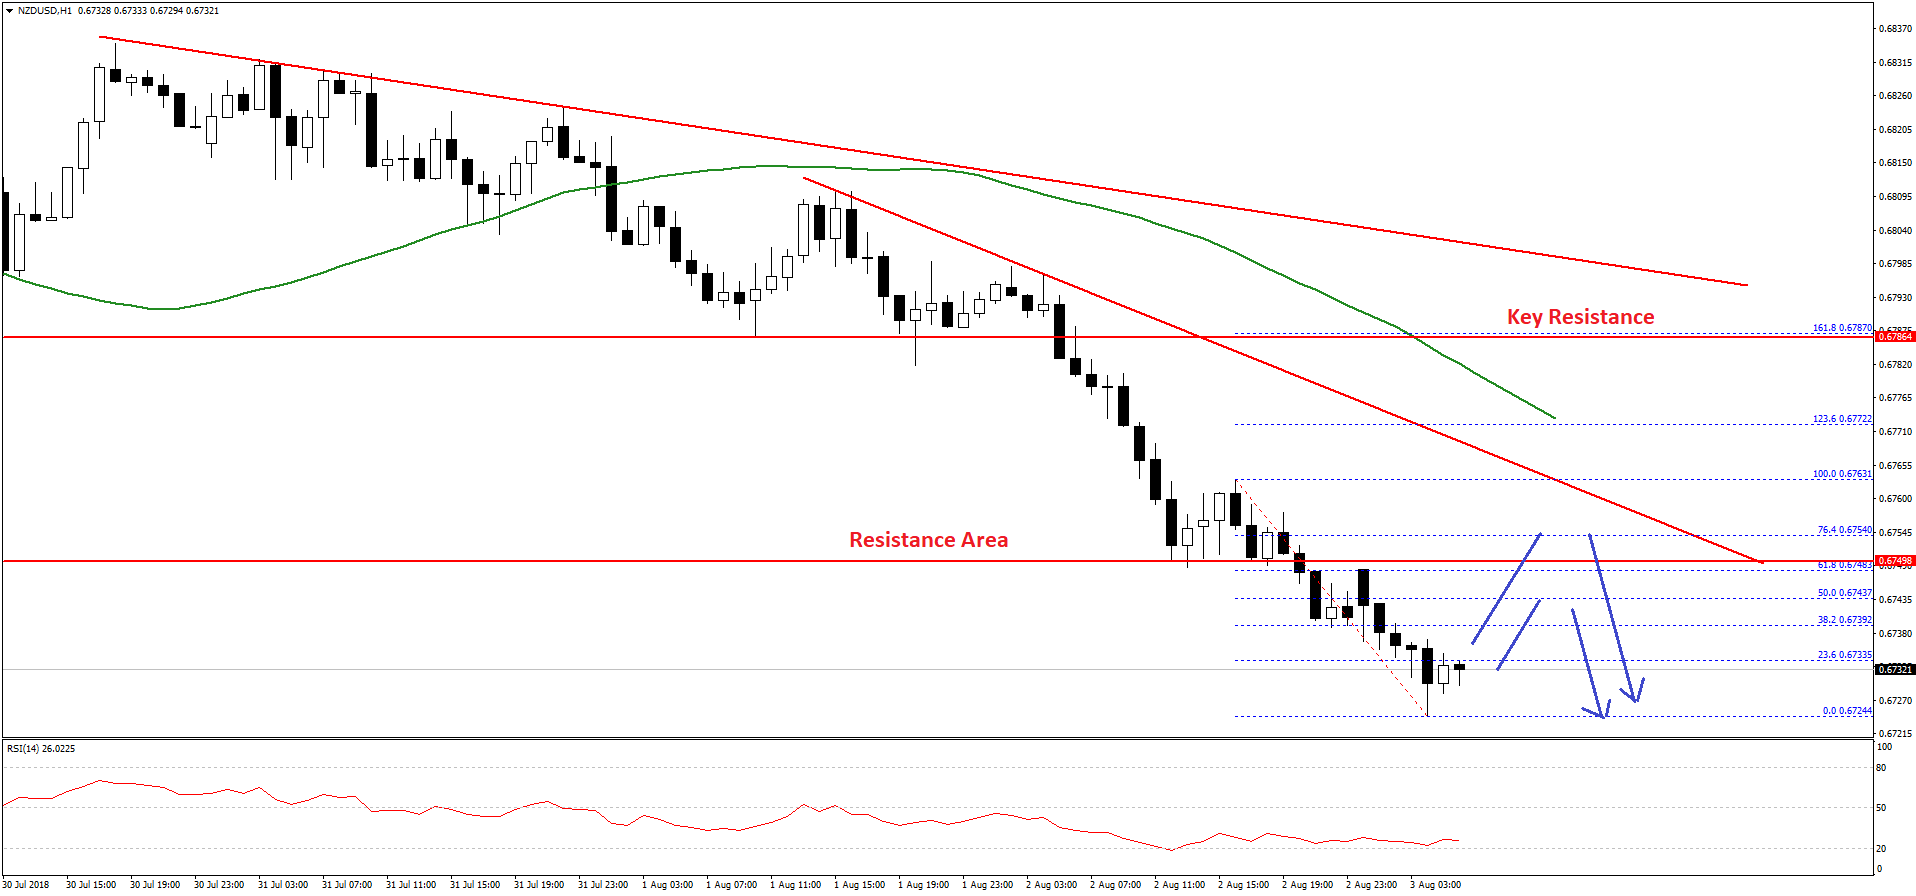
However, the most important resistance on the upside near the 0.6750 level, which was a support earlier. Moreover, there is a key bearish trend line in place with resistance at 0.6760 on the hourly chart.
An intermediate resistance is near the 50% Fib retracement level of the last decline from the 0.6763 high to 0.6724 low at 0.6743. Therefore, if the pair corrects higher, it is likely to face many hurdles near the 0.6750 and 0.6760 levels.
On the downside, the recent low near 0.6724 is a short term support. Should there be a break below this, the pair will most likely test the 0.6700 support. Any further declines could take NZD/USD towards the 0.6660 level.
Fundamentally, the July 2018 nonfarm payrolls report will be released in the US today. The forecast is slated for a rise of 190K in jobs, less than the last 213K. If the actual beats the forecast, pairs like EUR/USD, AUD/USD, GBP/USD and NZD/USD may possibly extend declines.
Trade over 50 forex markets 24 hours a day with FXOpen. Take advantage of low commissions, deep liquidity, and spreads from 0.0 pips. Open your FXOpen account now or learn more about trading forex with FXOpen.
This article represents the opinion of the Companies operating under the FXOpen brand only. It is not to be construed as an offer, solicitation, or recommendation with respect to products and services provided by the Companies operating under the FXOpen brand, nor is it to be considered financial advice.
Stay ahead of the market!
Subscribe now to our mailing list and receive the latest market news and insights delivered directly to your inbox.

Latest from Forex Analysis
Latest articles

Weekly Market Wrap With Gary Thomson: Nasdaq, EUR/USD, USD/CHF, Brent Crude Oil, Googl Shares
Get the latest scoop on the week's hottest headlines, all in one convenient video. Join Gary Thomson, the COO of FXOpen UK, as he breaks down the most significant news reports and shares his expert insights.
- Nasdaq Composite: Worst Session

Analysis of AUD/USD: Exchange Rate Falls to Early May Low
As indicated by the 4-hour AUD/USD chart today:
→ the rate fell below 0.652, a level last seen on May 2;
→ the RSI indicator dropped below 15, a level last seen during the panic over the spread of COVID-19

Analysis of AMZN Stock: Price at 1.5-Month Low
As shown in the AMZN chart, the stock price dropped below:
→ the psychological level of $180;
→ the mid-June interim low.
The last time AMZN traded below $180 was in early June.
Thus, AMZN has faced sell-offs, similar to other tech