


AUD/USD and NZD/USD Signaling Upside Continuation
FXOpen

AUD/USD found support above the 0.6900 level and recently climbed above 0.6950. Similarly, there were decent gains in NZD/USD above the 0.6600 and 0.6640 resistance levels.
Important Takeaways for AUD/USD and NZD/USD
- The Aussie Dollar started a strong recovery after trading as low as 0.6910 against the US Dollar.
- There was a break above a major bearish trend line with resistance near 0.6955 on the hourly chart of AUD/USD.
- NZD/USD also started a decent upward move after it settled above the 0.6600 pivot level.
- There was a clear break above a key bearish trend line with resistance near 0.6610 on the hourly chart.
AUD/USD Technical Analysis
In the past few days, the Aussie Dollar declined steadily below 0.7000 against the US Dollar. The AUD/USD pair broke the 0.6950 support level before it found support above the 0.6900 level.
A swing low was formed near 0.6910 on FXOpen and the pair recently started a decent recovery. It broke the 0.6920 and 0.6925 resistance levels to start the recent recovery. Later, there was a close above the 0.6950 resistance and the 50 hourly simple moving average.
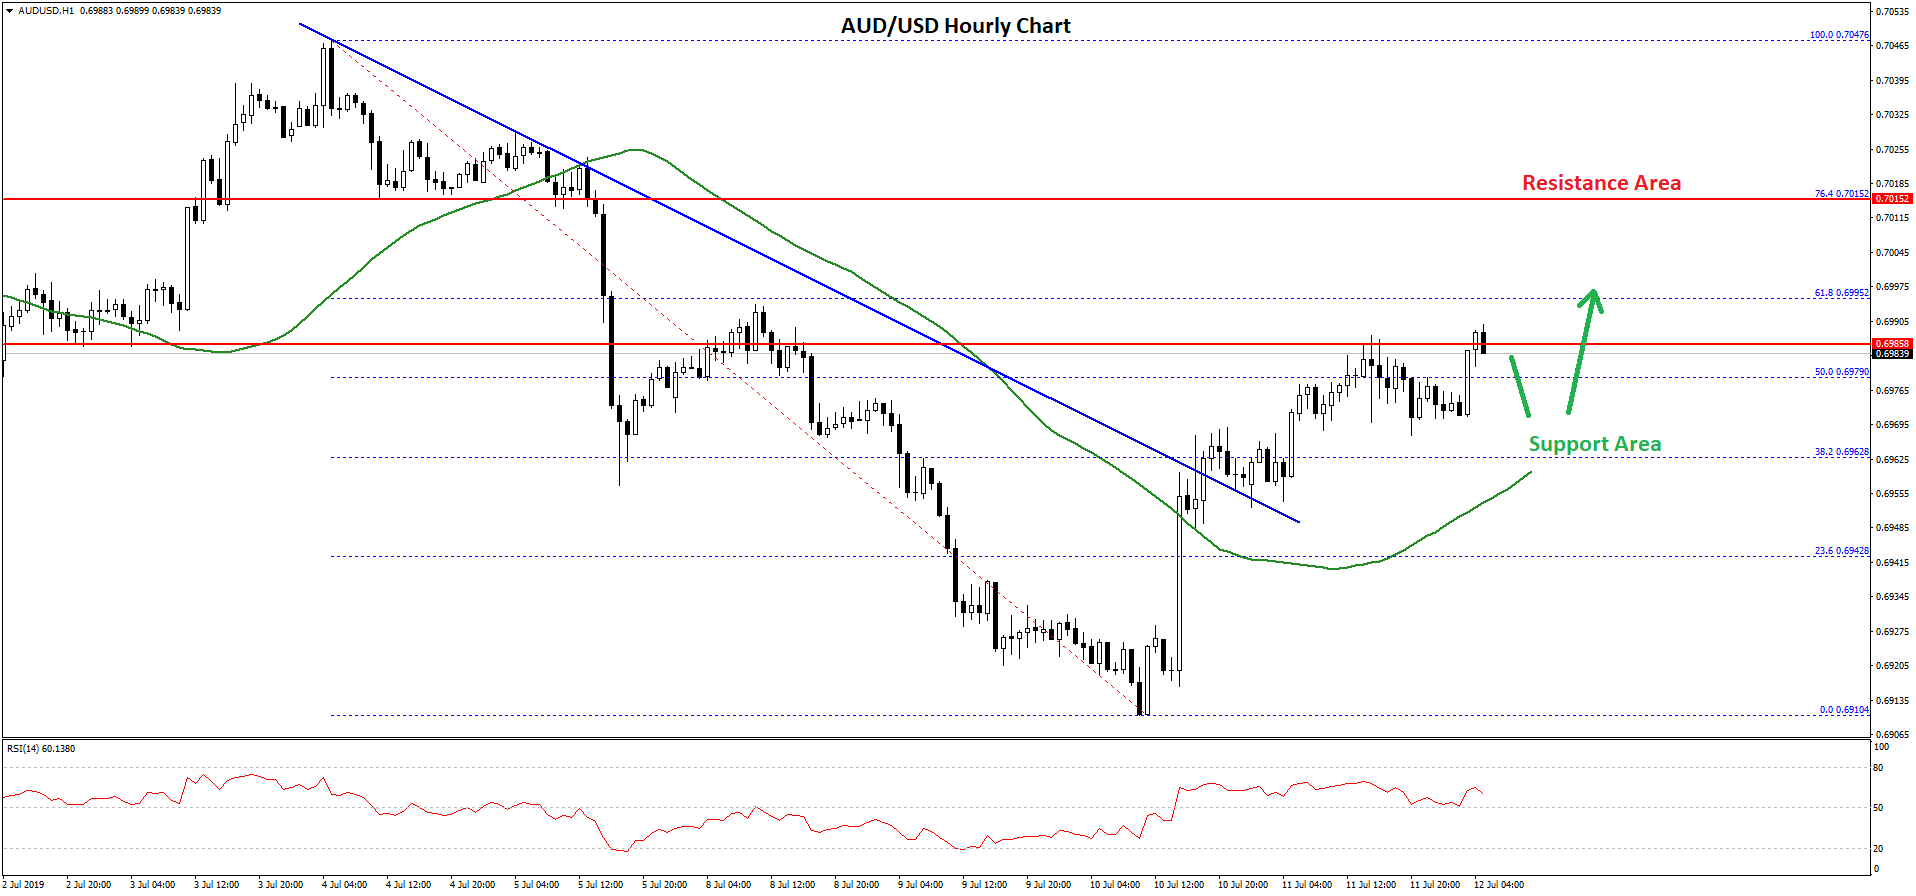
Besides, the pair successfully broke a major bearish trend line with resistance near 0.6955 on the hourly chart. It opened the doors for more gains above the 0.6970 level.
The pair climbed above the 50% Fib retracement level of the last major decline from the 0.7047 high to 0.6910 low. However, there are a few important resistances on the upside near the 0.6990 and 0.7000 levels.
The 61.8% Fib retracement level of the last major decline from the 0.7047 high to 0.6910 low is also near the 0.6990 level. Therefore, if there is an upside break above the 0.7000 level, the pair could continue to rise.
The next major resistance above 0.7000 is near the 0.7040 and 0.7050 levels. On the downside, there is a strong support forming near the 0.6955 level and the 50 hourly simple moving average.
Therefore, if there is a downside break below 0.6950 and the 50 hourly simple moving average, AUD/USD could start a fresh decline.
NZD/USD Technical Analysis
The New Zealand Dollar also followed a similar path and started a decent recovery after trading close to the 0.6550 level against the US Dollar. The NZD/USD pair traded as low as 0.6567 and recently recovered above the 0.6600 level.
After there was a close above the 0.6600 level and the 50 hourly simple moving average, the pair gained bullish momentum. During the rise, the pair broke a few important resistances near the 0.6640 level.
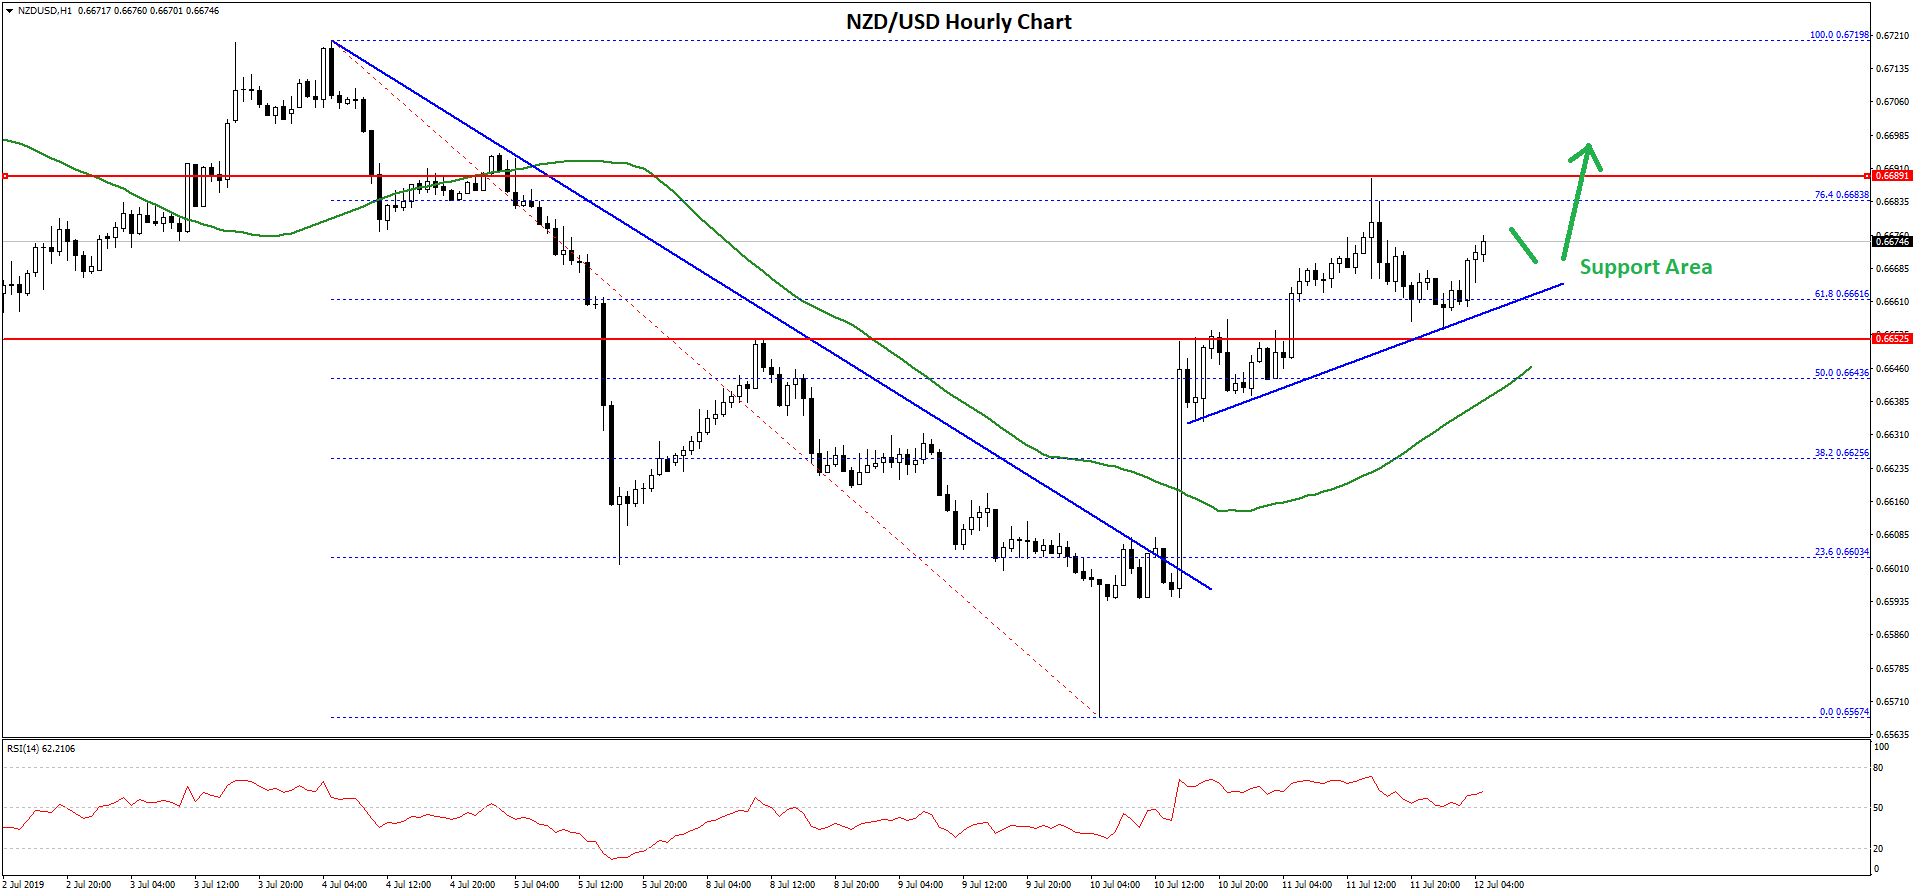
There was a clear break above a key bearish trend line with resistance near 0.6610 on the hourly chart. The pair even climbed above the 61.8% Fib retracement level of the last major drop from the 0.6719 high to 0.6567 low.
However, the pair seems to be facing resistance near the 0.6690 and 0.6700 levels. The 76.4% Fib retracement level of the last major drop from the 0.6719 high to 0.6567 low is also acting as a resistance.
If there is an upside break above the 0.7000 level, the pair could continue to rise towards the 0.7020 and 0.7040 levels in the near term.
On the downside, there is a connecting bullish trend line forming with support near 0.6660. If NZD/USD trades below 0.6660 and 0.6650, it could start a fresh decline.
Trade over 50 forex markets 24 hours a day with FXOpen. Take advantage of low commissions, deep liquidity, and spreads from 0.0 pips (additional fees may apply). Open your FXOpen account now or learn more about trading forex with FXOpen.
This article represents the opinion of the Companies operating under the FXOpen brand only. It is not to be construed as an offer, solicitation, or recommendation with respect to products and services provided by the Companies operating under the FXOpen brand, nor is it to be considered financial advice.
Stay ahead of the market!
Subscribe now to our mailing list and receive the latest market news and insights delivered directly to your inbox.


Latest articles

DAX 40: consolidation amid technology sell-off
A wave of selling in the technology sector that emerged earlier this week has weighed on European equities. The trigger was investor concern over the profitability of large-scale debt-funded investments by major US tech companies in AI infrastructure. The Nasdaq

Euro Hits Fresh Yearly Lows Amid Dovish ECB Signals
The euro remains under pressure following weak macroeconomic data from the euro area and fresh signals that the European Central Bank is prepared to maintain a more accommodative monetary policy stance. Data released yesterday pointed to a deterioration in business

Pound at Key Levels: Markets Assess Impact of Political Uncertainty in the UK
The British pound remains under pressure following increased political uncertainty in the United Kingdom triggered by the Prime Minister’s resignation. Investors are assessing potential shifts in the political and economic policy outlook after the head of government stepped down,