


FXOpen
AUD/USD started a fresh increase above the 0.7320 resistance zone. NZD/USD also climbed higher and it might continue to rise towards the 0.7120 level.
Important Takeaways for AUD/USD and NZD/USD
· The Aussie Dollar started a steady increase above the 0.7320 hurdle against the US Dollar.
· There was a break above a key declining channel with resistance near 0.7350 on the hourly chart of AUD/USD.
· NZD/USD also gained pace after it broke the 0.6970 resistance.
· There is a key rising channel forming with support near 0.7040 on the hourly chart of NZD/USD.
AUD/USD Technical Analysis
The Aussie Dollar found formed a base above the 0.7280 level and started a fresh increase against the US Dollar. The AUD/USD pair broke the 0.7300 and 0.7320 resistance levels to move into a positive zone.
The pair even broke the 0.7350 and 0.7380 resistance levels. There was a break above a key declining channel with resistance near 0.7350 on the hourly chart of AUD/USD. The pair even cleared the 0.7400 level and the 50 hourly simple moving average.
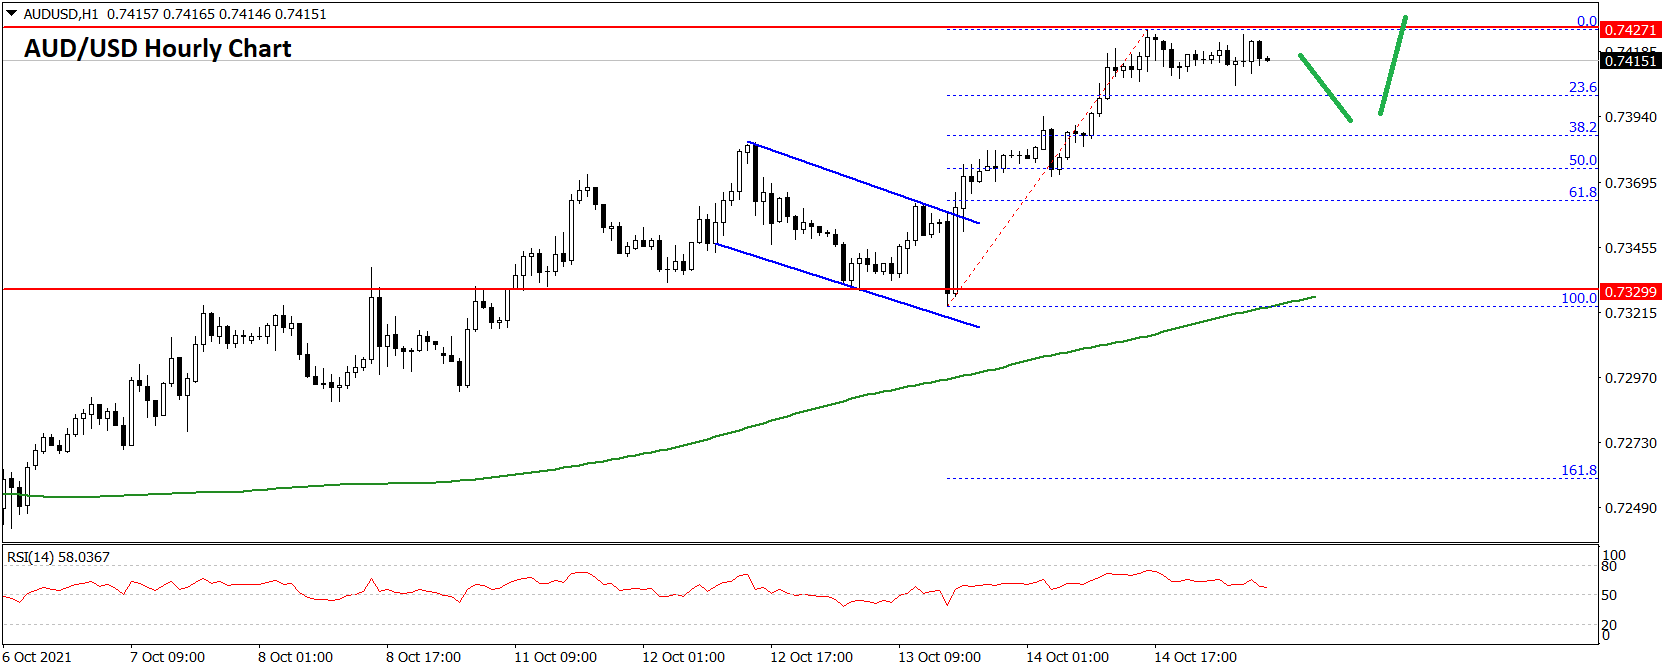
A high was formed near 0.7424 on FXOpen and the pair is now consolidating gains. It is trading above the 23.6% Fib retracement level of the recent wave from the 0.7323 swing low to 0.7424 high.
An initial support on the downside is near the 0.7400 level. The next major support is near the 0.7370 level. It is close to the 50% Fib retracement level of the recent wave from the 0.7323 swing low to 0.7424 high.
If there is a downside break below the 0.7370 support, the pair could extend its decline towards the 0.7330 level and the 50 hourly simple moving average.
An immediate resistance is near the 0.7425 level. The next major resistance is near the 0.7440 level. A close above the 0.7440 level could start a steady increase in the near term. The next major resistance could be 0.7500.
NZD/USD Technical Analysis
The New Zealand Dollar also followed a similar path from the 0.6900 zone against the US Dollar. The NZD/USD pair formed a base near 0.6920 and started a fresh increase.
The pair broke the 0.6950 and 0.7000 resistance levels. It even cleared the 0.7040 level and the 50 hourly simple moving average. A high was formed near 0.7052 and the pair is now consolidating gains.
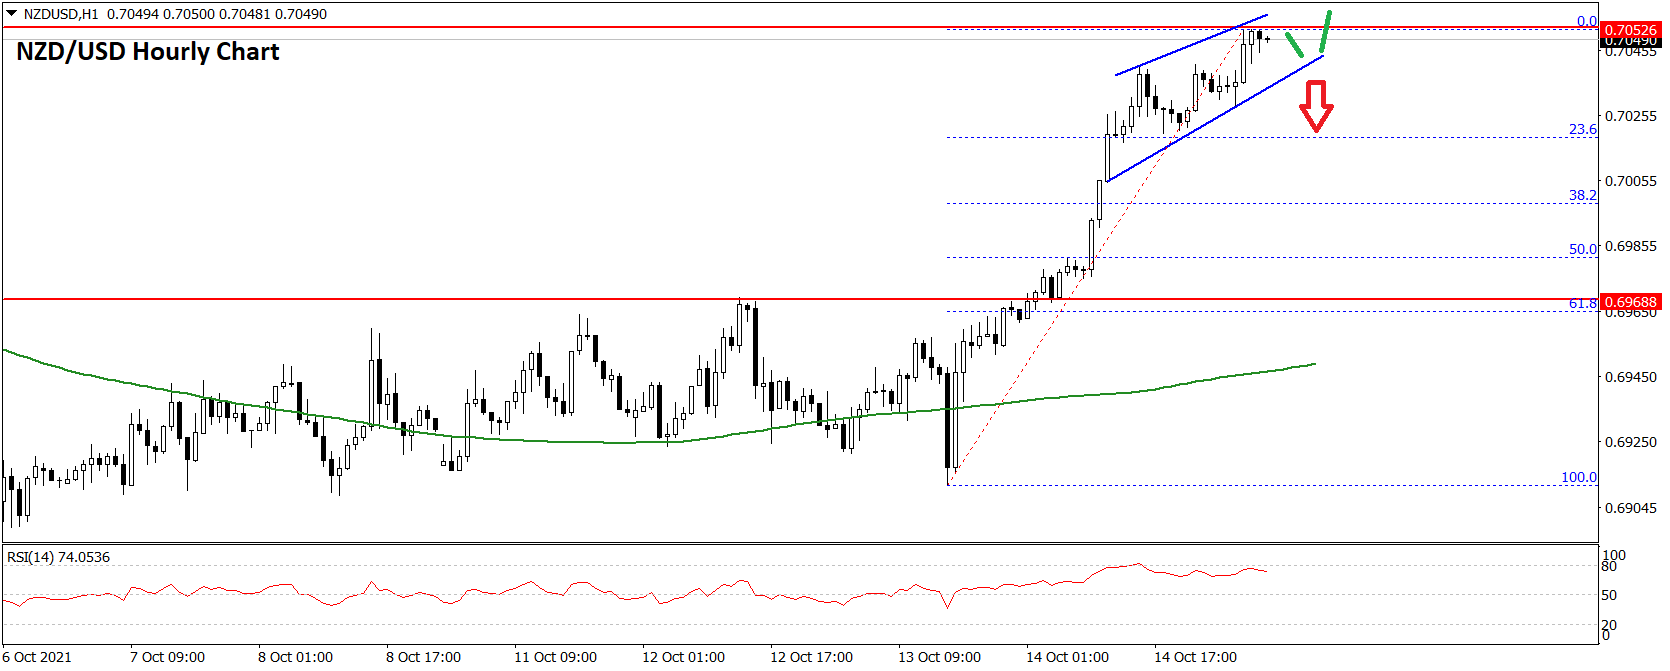
An immediate support is near the 0.7040 level. There is also a key rising channel forming with support near 0.7040 on the hourly chart of NZD/USD. The next major support is near 0.7020. It is near the 23.6% Fib retracement level of the recent increase from the 0.6911 swing low to 0.7052 high.
If there is a downside break below the 0.7020 support, the pair could extend its decline towards the 0.7000 level. The next key support may be the 50% Fib retracement level of the recent increase from the 0.6911 swing low to 0.7052 high.
On the upside, the bulls are facing hurdles near 0.7055. The next major resistance is near the 0.7080 level. A close above the 0.7080 level could start a steady increase in the near term. The next major stop for the bulls could be 0.7120.
This forecast represents FXOpen Markets Limited opinion only, it should not be construed as an offer, invitation or recommendation in respect to FXOpen Markets Limited products and services or as financial advice.
This article represents the opinion of the Companies operating under the FXOpen brand only. It is not to be construed as an offer, solicitation, or recommendation with respect to products and services provided by the Companies operating under the FXOpen brand, nor is it to be considered financial advice.
Stay ahead of the market!
Subscribe now to our mailing list and receive the latest market news and insights delivered directly to your inbox.

Latest articles

FX Markets Are Changing: What’s Driving Currencies Now?
FX markets have become increasingly reactive in March, with geopolitical developments—particularly the US–Iran conflict—driving price action across currencies, commodities, and interest rate expectations.
In this update, we examine the key forces shaping the FX market right now,

GBP/USD Rises Following Bank of England Decision
Yesterday, the Bank of England’s decision had a significant impact on the pound, which strengthened against other currencies. Although the Official Bank Rate remained unchanged at 3.75%, the market was surprised by the “hawkish” signals, which sharply contrasted

S&P 500 Analysis: Index Falls to Year-to-Date Low
As the S&P 500 chart (US SPX 500 mini on FXOpen) shows, the index dropped below the 6,570 level yesterday for the first time in 2026. As a result, the equity market may be on track to